26.09.2022 by Dr. Natalie Rudolph
How to Speed Up your Digital Light Synthesis Process by 73% with Thermal Analysis
Imagine being a baker and receiving an enquiry for 100 cakes to be delivered on one specific day. It takes you 10 minutes to prepare the dough for one cake. The dough needs to be baked for 90 minutes to reach its perfectly moist consistency. You only have one oven as you cannot afford buying more. You are significantly limited in your production capacity due to the long baking time. Speeding up the baking process would significantly boost your outcome, but you do not want to taint the high quality of your product.
Manufacturers of complex polymer-based objects with Digital Light Synthesis (DLS) technology face very similar problems. Formerly used for rapid prototyping, additive manufacturing (AM) has seen significant growth in the last 10 years. Reasons include the improvement of manufacturing processes and materials as well as the high quality of final parts. A popular AM technique is DLS, which falls into the group of Vat Photopolymerization processes.
Learn more about Additive Manufacturing (AM) by watching our series on YouTube: #ambynetzsch – YouTube
What is Digital Light Synthesis (DLS)?
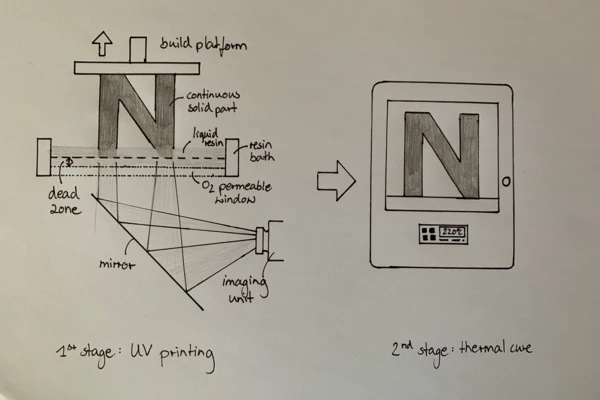
“The Digital Light Synthesis™ process is breakthrough technology that uses digital light projection, oxygen-permeable optics, and programmable liquid resins to produce parts with exceptional mechanical properties, resolution, and surface finish. The Digital Light Synthesis process is driven by Continuous Liquid Interface Production™, or CLIP™, and programmable liquid resins.
CLIP is a photochemical process that cures liquid plastic resin into solid parts using ultraviolet light. It works by projecting light through an oxygen-permeable window into a reservoir of UV-curable resin. As a sequence of UV images is projected, the part solidifies and the build platform rises” [2].
There are materials that cure in a single step. However, for more advanced applications, the required materials “are enabled by proprietary two-stage resin reaction technology” [1]. The photopolymerization occurring in the printer is the first Curing (Crosslinking Reactions)Literally translated, the term “crosslinking“ means “cross networking”. In the chemical context, it is used for reactions in which molecules are linked together by introducing covalent bonds and forming three-dimensional networks.curing step. After removing the parts from the printer, they are thermally cured by an external heat source. This second step in the production process with DLS is where its major limitation arises, as the Curing (Crosslinking Reactions)Literally translated, the term “crosslinking“ means “cross networking”. In the chemical context, it is used for reactions in which molecules are linked together by introducing covalent bonds and forming three-dimensional networks.curing time can last several hours depending on the resin system.
In their paper “Thermal Curing (Crosslinking Reactions)Literally translated, the term “crosslinking“ means “cross networking”. In the chemical context, it is used for reactions in which molecules are linked together by introducing covalent bonds and forming three-dimensional networks.curing kinetics optimization of epoxy resin in Digital Light Synthesis”, AlexRedmanna, PaulOehlmanna, ThomasSchefflerb, LukasKagermeiera and Tim A.Osswalda investigate the optimization of the thermal Curing (Crosslinking Reactions)Literally translated, the term “crosslinking“ means “cross networking”. In the chemical context, it is used for reactions in which molecules are linked together by introducing covalent bonds and forming three-dimensional networks.curing cycle “by reducing the thermal Curing (Crosslinking Reactions)Literally translated, the term “crosslinking“ means “cross networking”. In the chemical context, it is used for reactions in which molecules are linked together by introducing covalent bonds and forming three-dimensional networks.curing time while avoiding a negative influence on the final mechanical properties” [1] of the epoxy-based resin EPX 82.
Three steps to an optimized DLS process
- Differential scanning calorimetry (DSC) to characterize the curing behavior of thermosetting resin EPX 82 (dual-curing epoxy resin)
- Model the chemical curing behavior with kinetic analysis
- Dynamic Mechanical Analysis (DMA) and tensile testing to validate the suggested improvements in the curing cycle
Determining the curing behavior of thermosetting resins
“Differential Scanning Calorimetry is one of the most common techniques to characterize thermosetting resins by measuring the heat flow resulting from the change in internal energy as a result of the ExothermicA sample transition or a reaction is exothermic if heat is generated.exothermic cure” [1]. Similarly, the Glass Transition TemperatureThe glass transition is one of the most important properties of amorphous and semi-crystalline materials, e.g., inorganic glasses, amorphous metals, polymers, pharmaceuticals and food ingredients, etc., and describes the temperature region where the mechanical properties of the materials change from hard and brittle to more soft, deformable or rubbery.glass transition temperature can be derived as a function of the Degree of CureThe degree of curing describes the conversion achieved during crosslinking reactions (curing). degree of cure. In this context, the higher the Degree of CureThe degree of curing describes the conversion achieved during crosslinking reactions (curing). degree of cure, the higher the Glass Transition TemperatureThe glass transition is one of the most important properties of amorphous and semi-crystalline materials, e.g., inorganic glasses, amorphous metals, polymers, pharmaceuticals and food ingredients, etc., and describes the temperature region where the mechanical properties of the materials change from hard and brittle to more soft, deformable or rubbery.glass transition temperature.
Two different measurement methods can be used to determine the curing behavior of thermosets:
- “IsothermalTests at controlled and constant temperature are called isothermal.Isothermal measurements at different temperatures, leading to a time shift of the curing reaction. The main challenge of the IsothermalTests at controlled and constant temperature are called isothermal.isothermal measurement is to capture the initial reaction that can occur during pre-heating before the target measurement temperature is reached” [1].
- Dynamic ramp tests with different linear heating rates. The method allows for easier analysis of the heat flow curves and calculations of the reaction enthalpy.
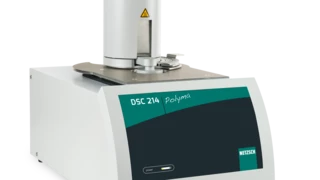
Characterization of the curing behavior of the material was carried out with the NETZSCH DSC 214 Polyma. The printed samples (diameter: 2.5 mm, height: 2 mm, mass: 10 mg +/- 1 mg) were shielded from any environmental influences (room temperature and UV-light) to avoid second-stage curing. “Stage 1 samples were ramped from 0°C to 330°C at heating rates of 0.5, 1, 2, 3, 4, and 5 K/min. A linear baseline was used to calculate the total heat of reaction. The Glass Transition TemperatureThe glass transition is one of the most important properties of amorphous and semi-crystalline materials, e.g., inorganic glasses, amorphous metals, polymers, pharmaceuticals and food ingredients, etc., and describes the temperature region where the mechanical properties of the materials change from hard and brittle to more soft, deformable or rubbery.glass transition temperatures were measured at different degrees of conversion using a temperature ramp from 0°C to 200°C at a heating rate of 10 K/min” [1].
The results show multiple peaks in the DSC signal, which indicates that the material undergoes a complex, multi-step reaction. With increasing heating rates,
· The peak reaction temperature shifts to higher temperatures,
· The curing enthalpy increases and
· A second reaction peak becomes more visible near 150°C.
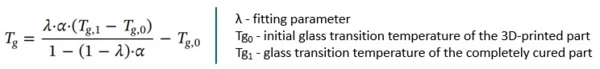
Additionally, the Glass Transition TemperatureThe glass transition is one of the most important properties of amorphous and semi-crystalline materials, e.g., inorganic glasses, amorphous metals, polymers, pharmaceuticals and food ingredients, etc., and describes the temperature region where the mechanical properties of the materials change from hard and brittle to more soft, deformable or rubbery.glass transition temperature increases with a higher degree of thermal stage conversion. The relationship between the two can be described with the Di Benedetto relationship (Eq. 1). This is used later in the reaction model to represent the Glass Transition TemperatureThe glass transition is one of the most important properties of amorphous and semi-crystalline materials, e.g., inorganic glasses, amorphous metals, polymers, pharmaceuticals and food ingredients, etc., and describes the temperature region where the mechanical properties of the materials change from hard and brittle to more soft, deformable or rubbery.glass transition temperature as a function of conversion and to consider for the diffusion control.
Model-free kinetic analysis and its limitations
The results of the DSC measurements are subsequently used for the modeling of the chemical curing behavior with kinetic analysis.
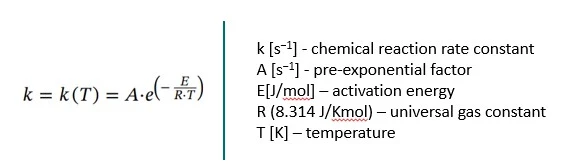
All kinetic analysis is based on the Arrhenius equation (Eq. 2) describing the temperature dependence of the reaction rate.
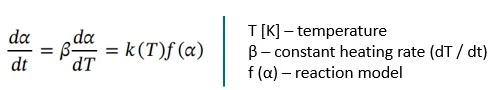
The conversion rate by time for IsothermalTests at controlled and constant temperature are called isothermal.isothermal reactions, dα / dt, or by temperature for dynamic heating rates, dα / dT, can then be described by the following equation:
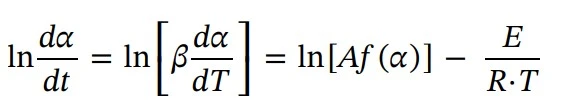
In order to calculate the activation energy (E), the Friedman method is a common approach. E is calculated as a function of the extent of conversion (α). Thus, the reaction is described by converting Eq. 3 into logarithmic form and substituting k(T) from Eq. 2.:
The model-free approach is very suitable as a first impression of the chemical reaction, as no development of a new reaction model or modification of existing models is necessary. However, multiple steps, simultaneous reactions and diffusion influence are not taken into account. This is important because “if the Glass Transition TemperatureThe glass transition is one of the most important properties of amorphous and semi-crystalline materials, e.g., inorganic glasses, amorphous metals, polymers, pharmaceuticals and food ingredients, etc., and describes the temperature region where the mechanical properties of the materials change from hard and brittle to more soft, deformable or rubbery.glass transition temperature of the polymer increases faster than the sample temperature, the reaction is no longer controlled by the kinetics of the chemical reaction, but by diffusion processes” [1]. Therefore, diffusion control is vital for avoiding inaccuracy in models, which would lead to vitrification, slowing the expected reaction rate and ultimately resulting in an insufficiently crosslinked part.
Simplified modelling of kinetic reactions with Kinetics Neo
Due to the limitations of the model-free approach, the NETZSCH Kinetics Neo software was used as it “provides the ability to combine different chemical reactions and test the accuracy of the corresponding model. […] It also provides the ability to consider for diffusion-controlled processes [1].
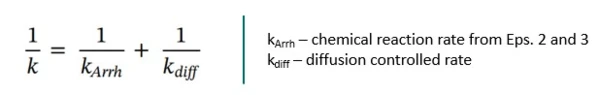
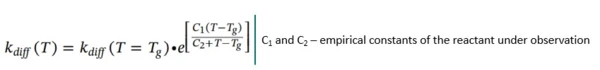
For temperatures above the Glass Transition TemperatureThe glass transition is one of the most important properties of amorphous and semi-crystalline materials, e.g., inorganic glasses, amorphous metals, polymers, pharmaceuticals and food ingredients, etc., and describes the temperature region where the mechanical properties of the materials change from hard and brittle to more soft, deformable or rubbery.glass transition temperature Tg (T >= Tg), the form of kdiff is modified from the Williams-Landel-Ferry relationship:
Kinetic Analysis applied in the Additive Manufacturing process
The model-free Friedman analysis is the starting point for the kinetic analysis of the chemical curing behavior of a resin. This initial analysis shows that “the activation energy (E) varies greatly with fractional conversion” [1].
Based on this result, different combinations of between two and four autocatalytic and nth order reaction steps were included to generate multiple reaction model predictions. Subsequently, the software calculates the optimal model parameters to fit the experimental data. A three-step linear model yielded the highest correlation factor of 0.9959.
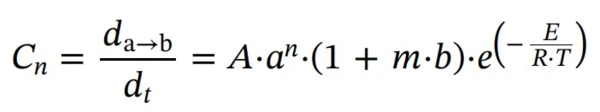
First step: reaction of nth order with autocatalysis by-product (Cn)
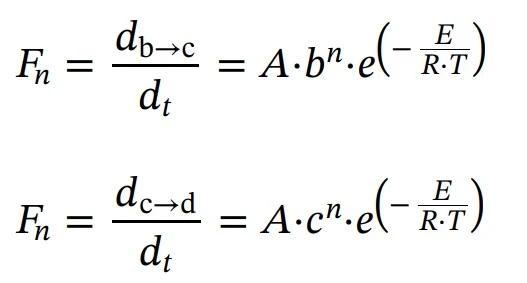
Subsequent three reactions: reactions of the nth order
Log(Kdiff), C1 and C2 parameters are responsible for the active diffusion control.
The third step of the reaction clearly requires the highest activation energy (166.81 kJ mol-1). This is in accordance with the prediction of the Friedman analysis. Simultaneously, it is the first reaction step that contributes most to the total chemical reaction.
The prediction curve and the fit match very well with a correlation of 0.9959. However, slight deviation does occur, albeit only in the initial portion of the reaction. One possible explanation for this would be that it is difficult to measure slow reactions with DSC, as there is a signal loss. The prediction becomes more accurate towards the end of the initial step.
Using the chemical reaction model for simulations
Next, the newly established chemical reaction model, as described above, was used to optimize the thermal curing cycle of the 3D-printed resin. The recommended thermal curing cycle was described by the manufacturer to be a nine-step curing cycle up to a temperature of 220°C, which required 12 hours and 30 minutes to complete. After also taking the physical limitations of the curing oven into consideration (MHR = 5 K/min, maximum temperature = 220°C), the developed model allowed for the identification of two significantly shorter cycles, with MCR 0.6 / MHR 5.0 and MCR 1.2 / MHR 1.0.
Checking for sufficient crosslinking of the material with DMA and tensile testing
In order to ensure that the thermal curing cycles, as suggested by the kinetic analysis, result in complete crosslinking and precise material properties, dynamic mechanical analysis (DMA) and tensile testing are performed on the final parts produced following the different curing cycles of the kinetic modeling variations. In this context, the Elastic modulusThe complex modulus (elastic component), storage modulus, or G’, is the “real” part of the samples the overall complex modulus. This elastic component indicates the solid like, or in phase, response of the sample being measurement. elastic modulus is an important material property. It increases by a factor of up to 20 during the thermal curing process due to the crosslinking of the material. “Parts that are sufficiently cross-linked will show a relatively constant Elastic modulusThe complex modulus (elastic component), storage modulus, or G’, is the “real” part of the samples the overall complex modulus. This elastic component indicates the solid like, or in phase, response of the sample being measurement. elastic modulus through a subsequent temperature ramp, followed by a sharp decrease in mechanical properties, indicating the Glass Transition TemperatureThe glass transition is one of the most important properties of amorphous and semi-crystalline materials, e.g., inorganic glasses, amorphous metals, polymers, pharmaceuticals and food ingredients, etc., and describes the temperature region where the mechanical properties of the materials change from hard and brittle to more soft, deformable or rubbery.glass transition temperature.” [1]
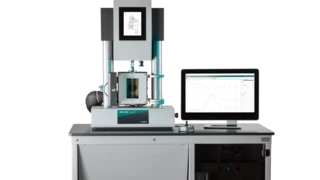
A NETZSCH GABO Eplexor® with a 500 N load cell and the 20-mm three-point bending fixture was used for the DMA measurements. The parameters are summarized in the following table.
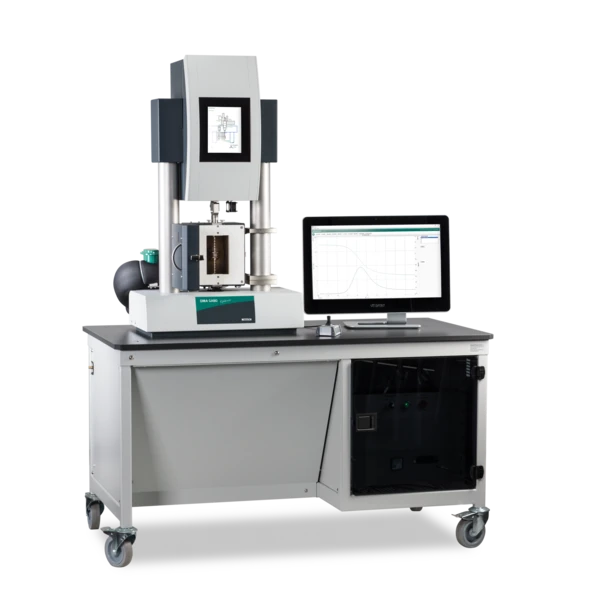
Table 1: DMA measurement conditions
| Temperature sweep | 40°C to 200°C |
| Heating rate | 2 K/min |
| Static StrainStrain describes a deformation of a material, which is loaded mechanically by an external force or stress. Rubber compounds show creep properties, if a static load is applied.strain | 0.2% (of sample thickness) |
| Dynamic sinusoidal StrainStrain describes a deformation of a material, which is loaded mechanically by an external force or stress. Rubber compounds show creep properties, if a static load is applied.strain | 0.15% (of sample thickness) |
| Frequency | 10 Hz |
The results show that the mechanical properties are influenced by the different curing cycles. “The samples cured with the highest maximum conversion rate and highest maximum heating rate (MCR 2.4 / MHR 5.0) are characterized by the lowest Tg at 146 °C. […] In comparison to the original cycle (MCR 0.6%/min and MHR 1 K/min), two significantly shorter cycles, MCR 0.6 / MHR 5.0 and MCR 1.2 / MHR 1.0, result in the same Tg at 154°C. The fastest of these cycles is the MCR 0.6 / MHR 5.0 with a total curing time of 202 min.” [1]
The samples of the original and the optimized cycle were additionally checked by tensile testing. Both samples showed a very similar ultimate tensile strength.
Conclusion
In their paper, the authors provide an effective methodology for optimizing the thermal curing kinetics of the resin in the Digital Light Synthesis process.
By means of DSC analysis, a three-step reaction model was developed. It considers for diffusion control in the reaction model by including the Rabinowitsch equation to calculate the reaction rate. The Di Benedetto relationship presents the Glass Transition TemperatureThe glass transition is one of the most important properties of amorphous and semi-crystalline materials, e.g., inorganic glasses, amorphous metals, polymers, pharmaceuticals and food ingredients, etc., and describes the temperature region where the mechanical properties of the materials change from hard and brittle to more soft, deformable or rubbery.glass transition temperature as a function of conversion. Kinetics Neo enabled the prediction of different curing cycles with defined boundary conditions (here: maximum conversion rate and maximum heating rate). The cured samples were tested by DMA and tensile testing, which confirmed complete crosslinking and precise material properties.
With this approach, the thermal curing cycle was reduced by 73%; from 12 hours and 30 minutes to only 3 hours and 22 minutes.
Sources
[1] https://doi.org/10.1016/j.addma.2019.101018
[2] https://www.carbon3d.com/3d-printer-models-carbon/our-technology/
Affiliations
a Polymer Engineering Center, Department of Mechanical Engineering, University of Wisconsin-Madison, Madison, WI, 53706, USA.
b Technical University of Chemnitz, Chemnitz, Germany
FREE E-Book
Thermal Analysis and Rheology in Polymer Additive Manufacturing
Discover the secrets behind AM's game-changing capabilities! Our newly released ebook delves deep into the heart of AM, unveiling the power of reliable material characterization techniques, specifically thermal analysis and rheology.