Introduction
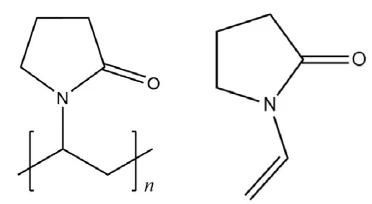
Polyvinylpyrrolidone (PVP) is a water-soluble polymer material with unique physicochemical properties. Since its discovery in the middle of the 20th century, it has rapidly become one of the three major new excipients in the field of pharmaceuticals by virtue of its excellent solubility, film formation, biocompatibility, and stability. It can be used as a co-solvent in tablets, granules, and injections, and also as a co-fluxing agent in capsules. Additionally, it serves as a dispersing agent for liquid formulations and coloring agents, a stabilizer for enzymes and heatsensitive drugs, and a co-precipitant for poorly soluble drugs. It is also used as a decontaminant in ophthalmic drugs and as a lubricant. Through a radical polymerization reaction, N-vinyl pyrrolidone (NVP) can be polymerized to polyvinylpyrrolidone (PVP). Hereby, the purity and quality of NVP directly affects the performance of PVP (strucural formulae of PVP and NVP see figure 1).
Measurement Parameters
The test sample was a white PVP powder. The test was performed using a NETZSCH STA Jupiter® coupled with a Bruker INVENIO. In this method, products released during thermogravmetric analysis are carried through a heated transfer line by a purge gas. This allows direct analysis and identification of the evolving substances in terms of their structure using the detector of the infrared spectrometer (FT-IR). Through the coupling of a thermobalance and an FT-IR, the change in sample mass with increasing temperature as well as the functional groups of the released gases are simultaneously measured. The measurement parameters are detailed in table1.
Table 1: TGA-FT-IR measurement conditions
| Instrument | STA Jupiter® Bruker INVENIO |
| Sample carrier | TGA type S |
| Temperature program | RT - 675°C |
| Heating rate | 10 K/min |
| Crucible | Al2O3, 300 μl, open |
| Sample mass | 39.77 mg |
| Gas atmosphere | Nitrogen |
| Gas flow rate | 70 ml/min |
FT-IR Measurement Parameters | |
| Spectral range | 4000 - 650 cm-1 |
| Resolution | 4 cm-1 |
| Scanning mode | Averaging 16 scans per spectrum |
| Detector | TE-DLaTGS |
Figure 2 shows the TGA-FT-IR measurements. The TGA curve shows that there are three mass-loss steps for the PVP sample. The first mass-loss interval was between RT and 136°C with a mass change of 0.99%; the second mass-loss interval was between 136°C and 252°C with a mass change of 1.06%; and the third mass-loss interval was between 252°C and 675°C with a mass change of 93.38%. The residual mass amounted to 4.55%. The DTG curve is the first-order derivative of the TGA curve, which reflects the mass-loss rate of the sample. Peaks in the DTG curve were found at 73.7°C, 211.1°C and 428.5°C. The Gram Schmidt curve, which displays the total IR intensities, is in good accordance with the DTG curve.
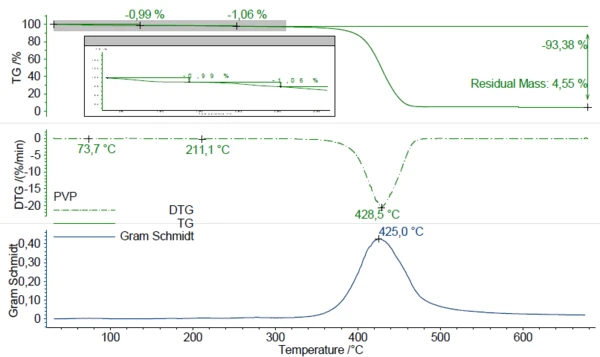
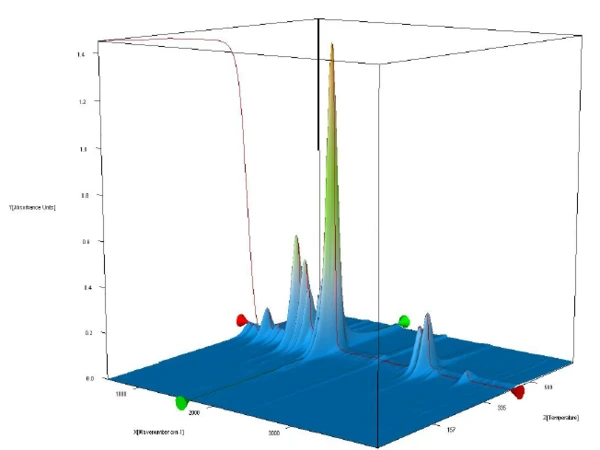
Figure 3 shows the complete FT-IR data for PVP in a temperature- and wave-number-dependent 3D plot. The TGA curve is plotted in red at the back and shows the correlation of mass loss to the increase in IR intensity.
For detailed evaluation of the IR data, individual spectra were taken at different temperatures and compared to the gas phase library. The infrared spectra extracted at 72°C, 171°C, 231°C, 282°C and 431°C can be seen in figure 4.
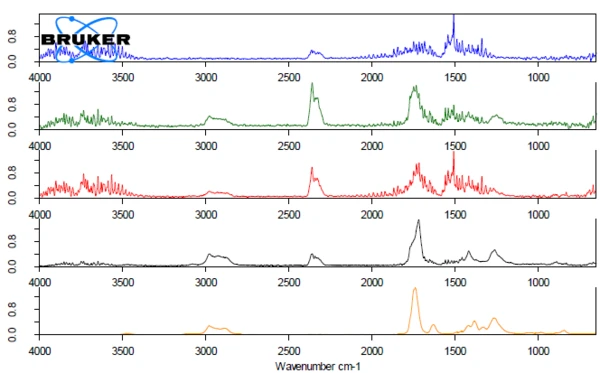
Water was released during the first two mass-loss steps in the temperature range up to 270°C; see the reference spectrum in figure 5. In the spectra extracted at 171°C, 213°C and 282°C, the release of CO2 was detected. The spectra at 171°C and 282°C also showed some similarity with 2-pyrrolidinone. A reference gas phase spectrum of NVP is not available.
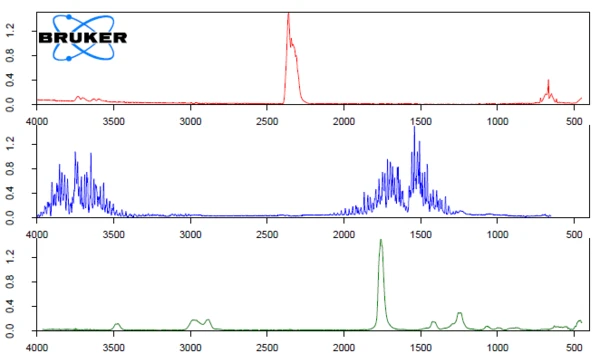
Figure 6 displays the FT-IR spectrum during the main Decomposition reactionA decomposition reaction is a thermally induced reaction of a chemical compound forming solid and/or gaseous products. decomposition step. The infrared optical absorption spectra of NVP and PVP differ due to the differences in molecular structure and polymerization effects. Table 2 shows the comparison of the characteristic peaks in the infrared absorption spectra of PVP and NVP. The C=O absorption peak of NVP is at a higher position (1748 cm-1), whereas that of PVP is usually in the range of 1650-1680 cm-1; and there is a vinyl group (C=C) in the molecule of NVP, whereas there is no such double bond in PVP.
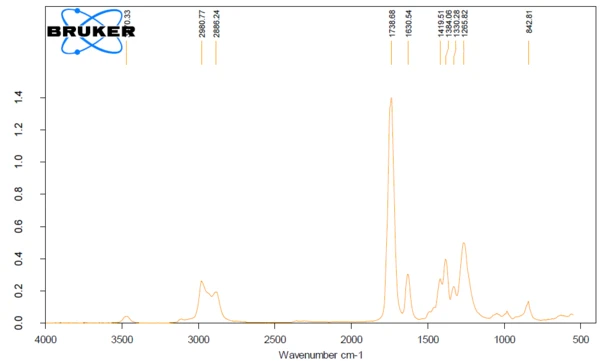
From the above analysis and the corresponding spectrum detected at 428°C, it is likely that the monomer NVP was detected. As a result, it can be concluded that the PVP sample decomposed above 350°C. In addition, a mixture of other PyrolysisPyrolysis is the thermal decomposition of organic compounds in an inert atmosphere.pyrolysis products is probably simultaneously released. This finding is consistent with the PyrolysisPyrolysis is the thermal decomposition of organic compounds in an inert atmosphere.pyrolysis process described in literature [1].
Table 2: Comparison of NVP (monomer) and PVP (polymer) characteristic infrared spectral peaks
Conclusion
As the demand for personalized medicine and complex formulations continues to grow, PVP is being utilized in increasingly innovative applications as a pharmaceutical excipient, such as in 3D-printed drug carriers and targeted drug delivery systems. This development expands its role and reinforces its significance in the pharmaceutical industry. By employing thermoanalytical coupling techniques, the composition of the gases released during the thermal Decomposition reactionA decomposition reaction is a thermally induced reaction of a chemical compound forming solid and/or gaseous products. decomposition of PVP can be analyzed, providing valuable insights for further product research. Additionally, understanding the PyrolysisPyrolysis is the thermal decomposition of organic compounds in an inert atmosphere.pyrolysis products of PVP is crucial for ensuring drug safety at higher temperatures, as this helps identify potential toxic byproducts that could affect drug stability and patient health.