Introduction
Poly(lactic acid) (PLA) is a biodegradable polymer derived from natural resources such as corn starch, that has received significant attention in recent years. It is one of the most prevalent biodegradable polymers in the market place due to availability, low cost of production and when derived from natural sustainable sources, it is a truly renewable polymer. Lactic acid is often combined with glycolic acid to form the copolymer poly(lactic-coglycolic acid) (PLGA), which can have varying composition of lactic and glycolic acids. Being a versatile polymer, it is used in a wide variety of applications from additive manufacture (3D printing) to disposable cutlery, biodegradable sutures, drug delivery, or as biodegradable packaging.
It is widely recognized that the bulk properties of polymers are strongly dependent on their molecular properties. Most commonly, the strongest determinant of a polymer’s strength is assumed to be its molecular weight.
However, in copolymers such as PLGA, it is also likely that copolymer composition will also strongly affect those properties.
This application note also uses Malvern technologies to explore the relationship between the molecular and bulk properties of PLA and PLGA. Rotational rheology is used to study melt viscosity, while the molecular weight and intrinsic viscosity is measured using the Malvern multidetector GPC.
Methods
Six samples of commercialy available substances were measured including:
- PLA
- PLGA with 75% LA and 25% GA (PLGA(75:25))
- PLGA with 65% LA and 35% GA (PLGA (63:35))
- Three samples of PLGA with 50% LA and 50% GA (PLGA (50:50)) with different molecular weights.
For the rotational rheology, samples were characterized using a Kinexus Ultra+ rotational rheometer. Samples were measured at 150°C using an active hood peltier plate cartridge with a parallel plate 20 mm geometry. Due to the nature of PLA being biodegradable, it is susceptible to degradation and therefore, measurements were performed whilst purging with nitrogen to reduce the risk of oxidative degradation during analysis.
For the Malvern multi-detector GPC, the samples were dissolved in THF and separated across two Malvern T6000M mixed-bed SVB columns. GPC was run on a Malvern OMNISEC system including refractive index (RI), light scattering (right-angle light scattering (RALS) and lowangle light scattering (LALS)), and viscometer detectors.
Test Results
Two experiments were performed. In the first experiment, three samples of PLGA(50:50) were measured by rotational rheometry and by multi-detector GPC. A representative chromatogram of ‘PLGA (50:50) 2’ is shown in figure 1.
Table 1 summarizes the results of the three samples. Samples were measured in duplicate. As can be seen, there were significant differences in the molecular weights of the three samples, ranging from T11 KDa to 69 KDa. The Kinexus rotational rheometer was then used to study ‘zero-shear’ melt viscosity, which is typically assumed to correlate with a sample’s molecular weight.
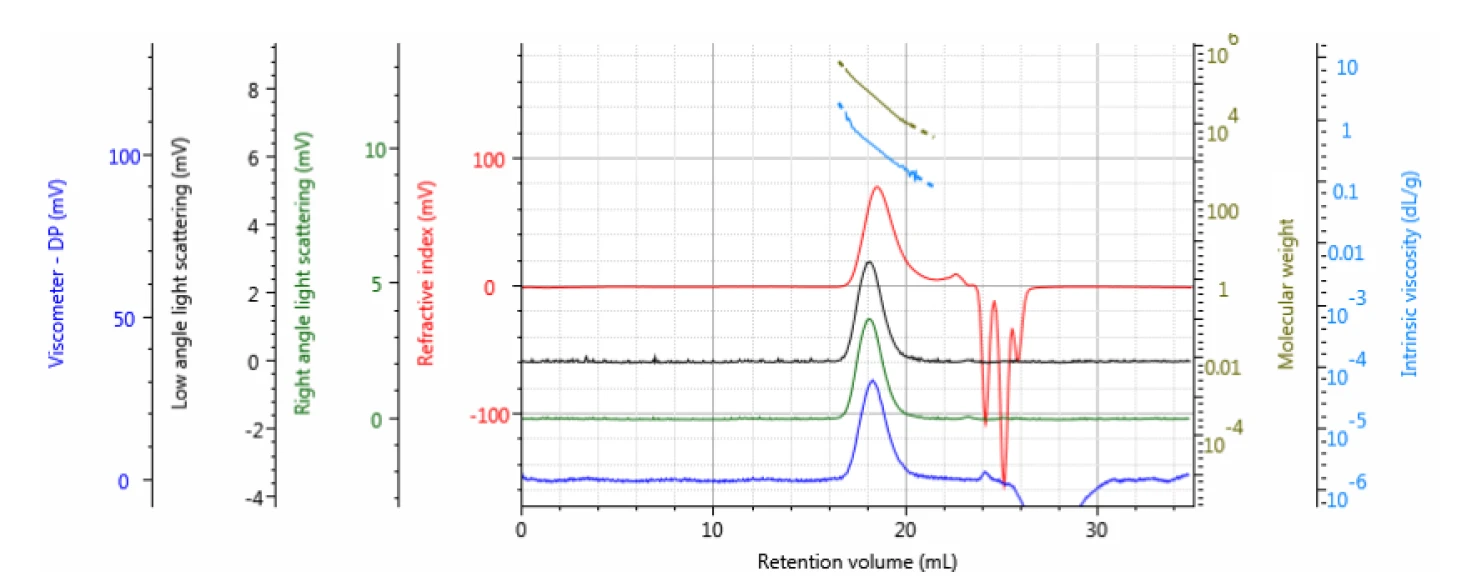
Table 1: Measured molecular data for the PLGA (50:50) samples in the first experiment
PLGA (50:50) 1 | PLGA (50:50) 2 | PLGA (50:50) 3 | ||||
| Measurement | Mean | % RSD | Mean | % RSD | Mean | % RSD |
| RV (mL) | 20.03 | 0 | 018.53 | 0.05088 | 18.17 | 0.01297 |
| Mn (g/mol) | 7.860 | 8.801 | 24.850 | 0.3569 | 37,010 | 5.037 |
| Mw (g/mol) | 11.350 | 1.394 | 45.650 | 0.3572 | 68.980 | 0.7617 |
| Mw/Mn | 1.449 | 7.411 | 1.837 | 3.96E-04 | 1.866 | 4.276 |
| IVw (dL/g) | 0.1463 | 0.5835 | 0.3343 | 0.1945 | 0.429 | 0.7332 |
| Rh(ŋ)w (nm) | 2.871 | 1.432 | 5.949 | 0.1864 | 7.436 | 0.8545 |
| M-H a | 0.6633 | 8.223 | 0.5424 | 14.6 | 0.5521 | 0.515 |
| M-H log K (dL/g) | -3.507 | -6.258 | -2.975 | -12.36 | -3.012 | -0.4615 |
| Recovery (%) | 106.3 | 0.2094 | 103.6 | 0.5221 | 102.9 | 0.04942 |
As can be seen in figure 2, the viscosity curves trend well with the molecular weight of the three samples. Sample 1 has the lowest molecular weight and the lowest viscosity. Samples 2 and 3 have higher molecular weights and correspondingly higher viscosities. This kind of molecular weight trend is typical and conforms well to our expectations.
A subsequent study was then performed on PLA and three different copolymers, PLGA (65:25), PLGA (75:25) and PLGA (50:50) 2 from the previous sample set. The molecular weight data is shown in table 2. As can be seen, the molecular weights for the samples vary between 11 KDa and 64 KDa.
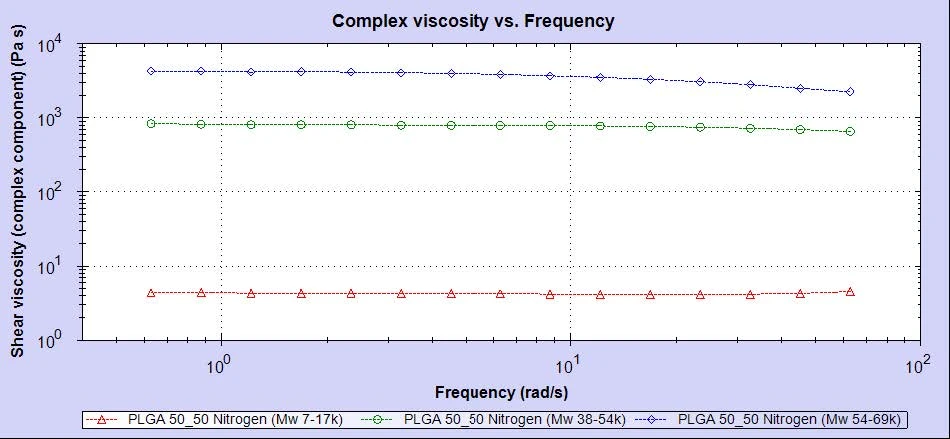
Table 2: Measured molecular data for the four PLA and PLGA samples compared in the second experiment
| PLA | PLGA (50:50) 2 | PLGA (65:35) | PLGA (75:25) | ||||
| Measurement | Mean | % RSD | Mean | % RSD | Mean | % RSD | Mean | % RSD |
| RV (mL) | 20.01 | 0.08247 | 18.53 | 0.05088 | 18.66 | 0.06317 | 18.12 | 0 |
| Mn (g/mol) | 8,083 | 15.92 | 24,850 | 0.3569 | 19,240 | 10.25 | 40,110 | 1.745 |
| Mw (g/mol) | 10,950 | 2.807 | 45,650 | 0.3572 | 34,870 | 1.548 | 64,260 | 0.8879 |
| Mw/Mn | 1.369 | 13.14 | 1.837 | 3.96E-04 | 1.821 | 8.709 | 1.607 | 0.8569 |
| IVw (dL/g) | 0.1942 | 1.039 | 0.3343 | 0.1945 | 0.3497 | 1.279 | 0.5631 | 0.2247 |
| Rh(ŋ)w (nm) | 3.134 | 1.886 | 5.949 | 0.1864 | 5.522 | 1.248 | 7.996 | 0.3095 |
| M-H a | 0.6553 | 1.96 | 0.5424 | 14.6 | 0.6835 | 10.72 | 0.6588 | 0.1613 |
| M-H log K (dL/g) | -3.344 | -1.504 | -2.975 | -12.36 | -3.534 | -9.343 | -3.39 | -0.162 |
| Recovery (%) | 93.08 | 0.6369 | 103.6 | 0.5221 | 100 | 1.13 | 89.34 | 0.2382 |
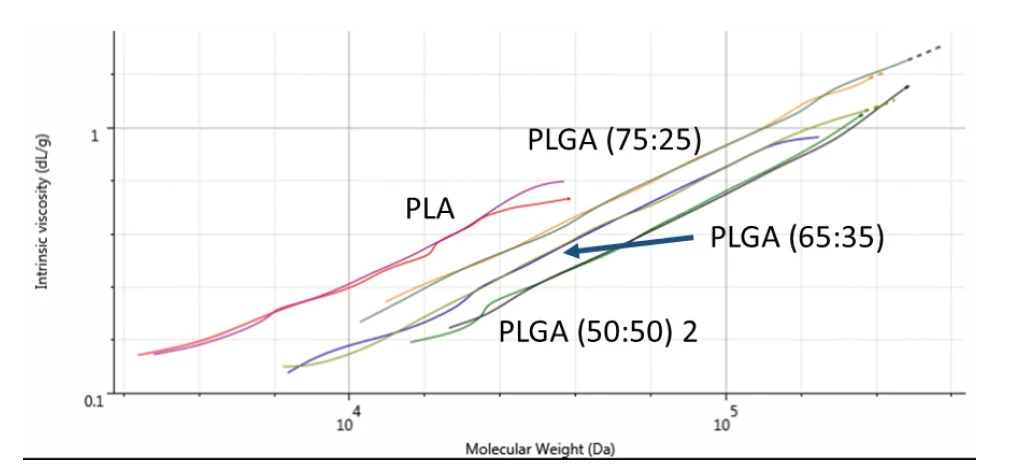
Since these samples have different compositions, their different structures can be compared on a Mark-Houwink plot. A Mark-Houwink plot shows intrinsic viscosity as a function of molecular weight. It allows for comparison of polymer structures at a range of molecular weights. It is most commonly used to study polymer branching but also indicates differences between linear molecules with different compositions, as in the PLA and PLGA copolymers. Figure 3 shows overlaid Mark-Houwink plots for the four samples. Results are shown in duplicate.
As can be seen, each polymer has its own line on the Mark-Houwink plot, which represents the molecule’s conformation, or DensityThe mass density is defined as the ratio between mass and volume. density, in solution. The plot here shows that PLA is the most open/extended of the samples. As the glycolic acid content increases, the polymers become increasingly, densely packed in solution. Intrinsic viscosity is a measure of a sample’s contribution to solution viscosity so may not correlate exactly with melt viscosity but the Mark-Houwink plot shows a clear trend in conformation that is dependent on glycolic acid content. The rheology results for these four samples are shown in figure 4.
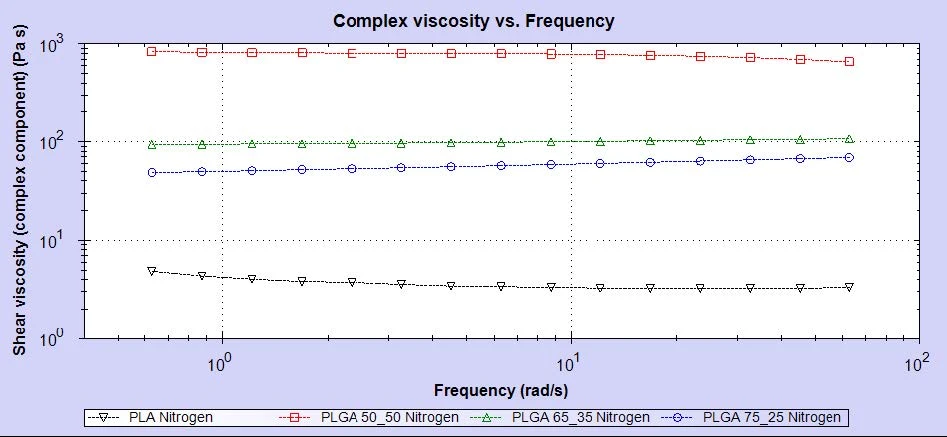
As can be seen in the data, there is a clear trend in the melt viscosity measurements but this does not correlate with molecular weight. While the PLA sample possesses the lowest molecular weight and has the lowest viscosity, the sample with the highest molecular weight is PLGA (75:25) which has the second lowest viscosity. The PLGA (50:50) sample has the highest viscosity despite only having the second highest molecular weight.
The trend in this case appears to be far more dependent on the glycolic acid content, with the sample possessing the highest glycolic acid content showing the highest viscosity and the sample with the least glycolic acid (PLA) displaying the lowest viscosity.
Clearly, the melt viscosity will be dependent on a combination of both of these parameters, however, the well-defined correlation between glycolic acid content and viscosity appears to dominate the overall relationship.
It is worth noting that the sample with the lowest intrinsic viscosity in the Mark-Houwink plot has the highest melt viscosity per the rheology data. This was contrary to expectations but does suggest an explanation. Since the molecules in the PLGA (50:50) sample are more compact and densely packed in the polymer, there is less free volume for the polymer chains to reptate and organize themselves. This therefore increases their resistance to flow and subsequently their melt viscosity.
Conclusions
The data presented in this application note elegantly show how the use of complementary polymer characterization technologies can offer excellent insights into the behavior of polymers such as PLA and PLGA. While it is widely accepted that the bulk properties (such as melt viscosity) of polymers are strongly linked to molecular properties (such as molecular weight) other factors, such as copolymer composition can also be significant factors.
In this study, rotational rheology was used to study melt viscosity while the Malvern multi-detector GPC was used to characterize the molecular properties of a series of PLA and PLGA samples. A clear molecular weight correlation was seen for PLGA samples of the same composition but when composition was varied as well, a strong correlation was observed for glycolic acid content. These kinds of insights can only be observed with a full characterization of samples of interest. In doing such measurements, it is possible to fully understand how the molecular properties affect the bulk performance.
By controlling such parameters, researchers and product developers can develop polymers with multiple ideal properties. For example, a PLGA copolymer could be chosen for a drug delivery application which has good melt viscosity for molding but also has the required degradation rates for a well-controlled timed release of the drug. In doing so, products can be developed that have better controlled performance characteristics, reduced failure rates, and higher value.