Introduction
The rheological properties of a material can influence how it is visually and texturally perceived and how it is likely to behave during processing. For example, very Shear ThinningThe most common type of non-Newtonian behavior is shear thinning or pseudoplastic flow, where the fluid viscosity decreases with increasing shear.shear thinning materials will be highly responsive to changes in applied StressStress is defined as a level of force applied on a sample with a well-defined cross section. (Stress = force/area). Samples having a circular or rectangular cross section can be compressed or stretched. Elastic materials like rubber can be stretched up to 5 to 10 times their original length.stress while Newtonian materials* will show much lesser dependence. Since most products of interest tend to be Shear ThinningThe most common type of non-Newtonian behavior is shear thinning or pseudoplastic flow, where the fluid viscosity decreases with increasing shear.shear thinning materials it is important to be able to quantify such behavior. This can be done by evaluating the power law region of a flow curve as shown in Figure 1. This region appears linear on a loglog plot of viscosity vs. shear rate with a constant gradient observed but shows power law dependence when plotted on a linear scale.
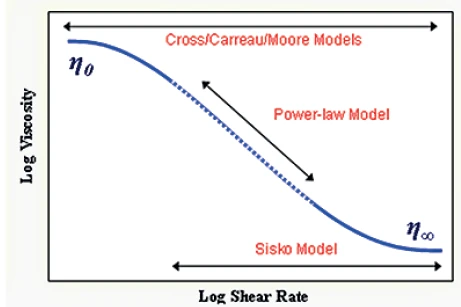
Mathematically, this region of the flow curve can be described using the Power Law or Ostwald de Waele Model given in Equation 1:
k is the consistency, n is the power law index, σ is the shear rate, ·γ is the shear rate.
Consistency has the units of Pasn but is numerically equal to the viscosity measured at 1s-1. The power law index ranges from 0 for very Shear ThinningThe most common type of non-Newtonian behavior is shear thinning or pseudoplastic flow, where the fluid viscosity decreases with increasing shear.shear thinning materials to 1 for Newtonian materials.
Once these parameters are known, the equation can be used to estimate the viscosity at any shear rate value within the Shear ThinningThe most common type of non-Newtonian behavior is shear thinning or pseudoplastic flow, where the fluid viscosity decreases with increasing shear.shear thinning region; however, it is important not to use the equation outside of the measured shear rate range since a Newtonian region may exist either side of the measurement region, depending on the material under test.
Experimental
- The Shear ThinningThe most common type of non-Newtonian behavior is shear thinning or pseudoplastic flow, where the fluid viscosity decreases with increasing shear.shear thinning behavior of a skin lotion was evaluated by performing a table of shear rate test and analyzing the resultant curve by fitting a Power Law ModelThe power law model is a common rheological model to quantify (typically) the shear thinning nature of a sample, with the value closer to zero indicating a more shear thinning material.power law model.
- Rotational rheometer measurements were made using the Kinexus rotational rheometer with a Peltier plate cartridge and a roughened parallel plate measuring system1, and using standard pre-configured sequences in the rSpace software.
- A standard loading sequence was used to ensure that both samples were subject to a consistent and controllable loading protocol.
- All rheology measurements were performed at 25°C.
- The flow curve was generated using an equilibrium table of shear rates test between 0.1 and 100 s-1 and a Power Law ModelThe power law model is a common rheological model to quantify (typically) the shear thinning nature of a sample, with the value closer to zero indicating a more shear thinning material.power law model fitted to a manually selected portion of this curve.
*Newtonian fluids are named after Sir Issac Newton (1642 - 1726) who described the flow behavior of fluids with a simple linear relation between shear StressStress is defined as a level of force applied on a sample with a well-defined cross section. (Stress = force/area). Samples having a circular or rectangular cross section can be compressed or stretched. Elastic materials like rubber can be stretched up to 5 to 10 times their original length.stress [mPa] and shear rate [1/s]. This relationship is now known as Newton‘s Law of Viscosity.
Results and Discussion
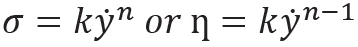
Figure 2 shows the viscosity-shear rate curve for the skin lotion. Clearly this product shows shear thinning behavior, evidenced by the rapid drop in viscosity with increasing shear rate. Although there is some slight curvature at higher shear rates, the data appears relatively straight on a double-logarithmic plot at lower shear rates.
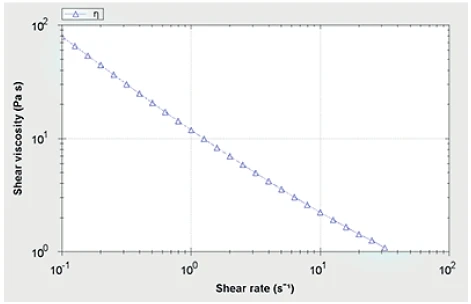
Due to the slight curvature above approximately 10 s-1, only data between between 0.1 and 10 s-1 has been included in the analysis since the data appears most linear in this region (when plotted logarithmically). The curves for both the model fitted and original data are shown graphically in Figure 3 and the fitting parameters and correlation coefficient are given in Table 1.
Table 1: Model fitting parameter data
| Sample Description | Experiment Name | Action Name | k1 | η | Chi square | Correlation Coefficient |
|---|---|---|---|---|---|---|
| Skin lotion | Analyse_0004-1 | Power Law ModelThe power law model is a common rheological model to quantify (typically) the shear thinning nature of a sample, with the value closer to zero indicating a more shear thinning material.Power Law Model Fit | 11.71 | 0.1735 | 617.2 | 0.9908 |
Considering that n = 1 for Newtonian materials and n = 0 for the most Non-NewtonianA non-Newtonian fluid is one that exhibits a viscosity that varies as a function of the applied shear rate or shear stress.non-Newtonian materials, then it can be established that this material is highly shear thinning. This shear thinning index can also be used to compare between different products for benchmarking purposes or to predict behavior in a relevant process or application, since this value is often required in many models describing the flow behavior on Non-NewtonianA non-Newtonian fluid is one that exhibits a viscosity that varies as a function of the applied shear rate or shear stress.non-Newtonian liquids. In general, the lower the value of n the more easily it should be broken down under the application of shear. The consistency k is numerically equal to the viscosity at 1 s-1 and has a value of 11.71 for this particular sample. This can be useful as a general measure of viscosity for comparative purposes.
The correlation coefficient is a good measure of how well the model fits the data with a value as close to unity as possible preferable. For this particular sample, the actual value is 0.988 indicating good correlation between measured and predicted data.
Figure 4 shows similar data for a number for other common consumer products and their corresponding fitting parameters.
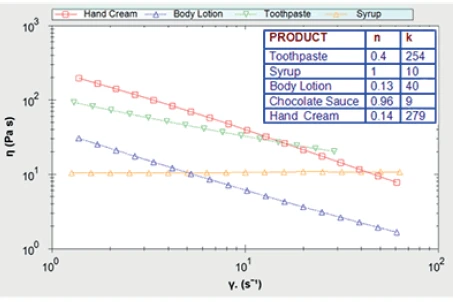
Once k and n have been determined, it is possible to use these values to predict the viscosity at any shear rate using the power law equation. This may prove useful in selecting optimum packaging, reformulating a product to meet specific requirements or determining how the product will behave during manufacture or on the packing line. This model, however, should only be used to predict behavior within the region where power law behavior is observed since it does not describe the curvature that may be observed at higher or lower shear rates. To describe behavior outside of this region, the Sisko or Cross models may be more appropriate.
Conclusion
The shear thinning behavior of a skin lotion was evaluated by performing a table of shear rate test and analyzing the resultant curve using a Power Law ModelThe power law model is a common rheological model to quantify (typically) the shear thinning nature of a sample, with the value closer to zero indicating a more shear thinning material.power law model.
The Power law model was found to give a good fit to the flow curve between 0.1 and 10 s-1 yielding a value of 0.1735 for n and a value of 11.71 for k. This indicates that the material is highly shear thinning with a viscosity 1000 times greater than water at a shear rate of 1 s-1.
Such a model has been shown to be useful for quantifying shear thinning behavior and also for comparing between products and formulations.
Please note: Testing is recommended to be undertaken with cone and plate or parallel plate geometry – with the latter being preferred for dispersions and emulsions with large particle sizes. Such material types may also require the use of serrated or roughened geometries to avoid artefacts relating to slippage at the geometry surface.