Introducción
Hoy en día, el método de Análisis Térmico Dinámico-Mecánico (ATDM) está bien establecido en la investigación de materiales para caucho y neumáticos. El desarrollo de nuevos compuestos, por ejemplo en la industria del neumático, requiere información detallada sobre las propiedades mecánicas de los materiales utilizados. Esto incluye la determinación de datos viscoelásticos del material que contengan el módulo de almacenamiento E', el Módulo viscosoEl módulo complejo (componente viscoso), módulo de pérdida o G'', es la parte "imaginaria" del módulo complejo global de la muestra. Este componente viscoso indica la respuesta líquida, o fuera de fase, de la muestra que se está midiendo. módulo de pérdida E" y el factor de pérdida tanδ, en función de la temperatura, la frecuencia de excitación y la deformación externa (por ejemplo, la tensión).
El ensayo de dureza superficial es muy popular. Desgraciadamente, la información sobre las propiedades viscoelásticas obtenidas mediante los ensayos de resistencia a la tracción es escasa en algunas áreas significativas. No se dispone en absoluto de datos sobre la dependencia de la temperatura y la frecuencia de los compuestos. Además, no se mide la deformación aplicada a las muestras durante el ensayo de apuntalamiento.
Sólo las investigaciones DMTA son capaces de arrojar los resultados deseados. Dado que las propiedades viscoelásticas (E', E", tanδ) de los sistemas de elastómeros dependen de la deformación aplicada externamente, los barridos de temperatura deben realizarse con amplitudes de deformación constantes en todo el intervalo de temperaturas de aplicación.
Debido a la elevada rigidez de los compuestos de caucho a temperaturas inferiores a la Tg de transición vítrea, se necesitan altos niveles de fuerza para obtener las deformaciones estáticas y dinámicas requeridas.
Normalmente, para los ensayos de compresión se utilizan muestras cilíndricas (muestras "Roelig") con una altura y un diámetro de 10 mm.
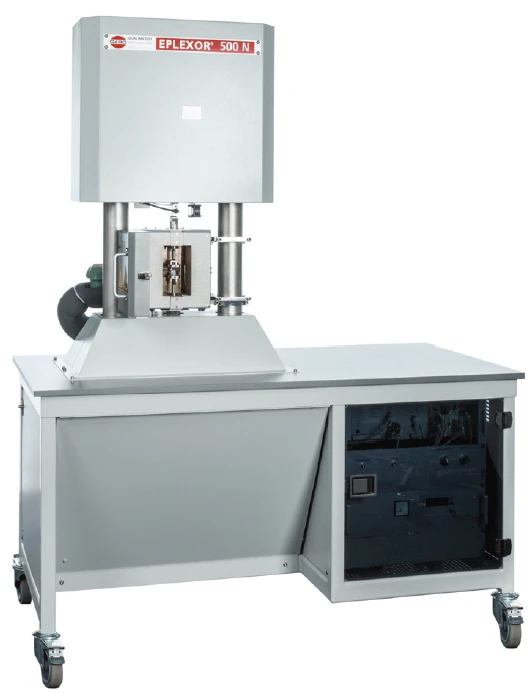
Suponiendo un módulo E' de 3.000 MPa, valor típico en estado vítreo, la capacidad de ensayo del instrumento requiere una amplitud de fuerza dinámica de +/-50 N para generar un alargamiento detectable de unos 2 μm. Esto no puede conseguirse con los instrumentos clásicos de DMA de laboratorio. Especialmente adecuado para estas tareas es el Eplexor® 500 N de NETZSCH GABO Instruments (véase la figura 1).
Los sistemas DMTA como la serie Eplexor® de NETZSCH GABO Instruments están equipados con accionamientos de alta potencia para realizar amplitudes adecuadas de altos niveles de fuerza.
En el control de calidad (CC), sin embargo, los largos barridos de temperatura resultan inconvenientes por razones económicas. Las pruebas de CC deben realizarse muy rápidamente. Una prueba de control de calidad, incluida la preparación de la muestra, debe terminarse en 20 minutos como máximo. Esta nota de aplicación ilustra cómo los barridos de temperatura pueden sustituirse por barridos de frecuencia, realizados cerca de la Tg.
Dependencia de la temperatura del caucho butílico (BR) y SBR 1500
Todos los barridos de temperatura se realizan con una deformación estática del 4% en relación con la longitud inicial de la muestra (10 mm para todas las muestras) dentro de un intervalo de temperatura de -80°C a 80°C. La amplitud de la deformación dinámica aplicada es de ± 0,2%; la frecuencia del ensayo es de 10 Hz. La amplitud de la deformación dinámica aplicada es de ± 0,2%; la frecuencia de ensayo es de 10 Hz.
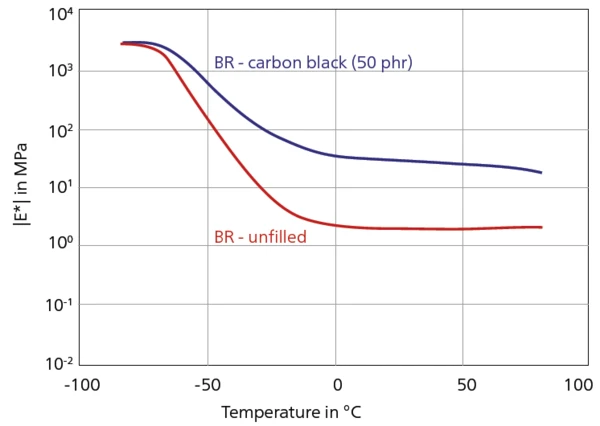
La figura 2 muestra el Módulo complejoEl módulo complejo consta de dos componentes, el módulo de almacenamiento y el módulo de pérdida. El módulo de almacenamiento (o módulo de Young) describe la rigidez y el módulo de pérdida describe el comportamiento de amortiguación (o viscoelástico) de la muestra correspondiente utilizando el método del Análisis Mecánico Dinámico (AMD). módulo complejo de una BR rellena (50 phr de Negro de humoLa temperatura y la atmósfera (gas de purga) afectan a los resultados del cambio de masa. Al cambiar la atmósfera de, por ejemplo, nitrógeno a aire durante la medición TGA, la separación y cuantificación de aditivos, por ejemplo, negro de carbono, y el polímero a granel puede llegar a ser posible.negro de humo) y de una BR sin rellenar en función de la temperatura.
Debido al contenido de Negro de humoLa temperatura y la atmósfera (gas de purga) afectan a los resultados del cambio de masa. Al cambiar la atmósfera de, por ejemplo, nitrógeno a aire durante la medición TGA, la separación y cuantificación de aditivos, por ejemplo, negro de carbono, y el polímero a granel puede llegar a ser posible.negro de humo, el módulo del BR relleno es unas 10 veces superior al del BR puro a temperaturas superiores a 0°C.
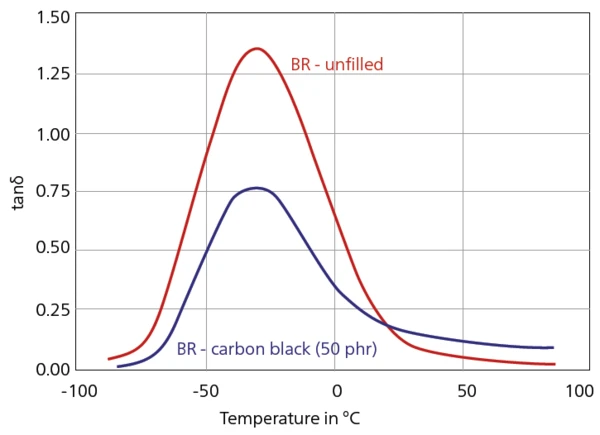
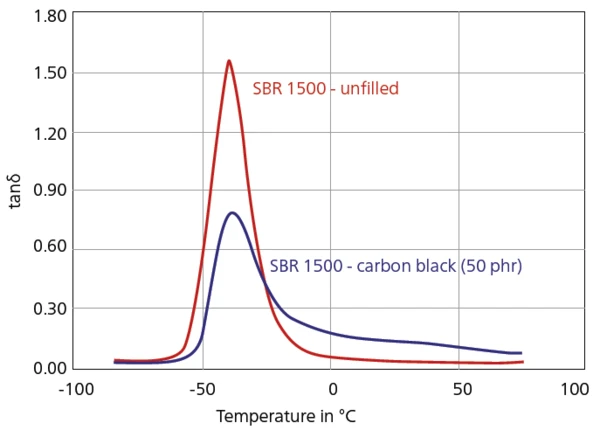
Los sistemas de BR rellenos y sin rellenar (figura 3) presentan una zona de transición vítrea muy amplia que cubre un intervalo de temperaturas de unos 50 K (semiancho del pico tanδ). Sin embargo, las alturas del pico tanδ de los dos sistemas son significativamente diferentes entre sí (relleno: el máximo del pico tanδ es 0,75, sin relleno: el máximo del pico tanδ es 1,3).
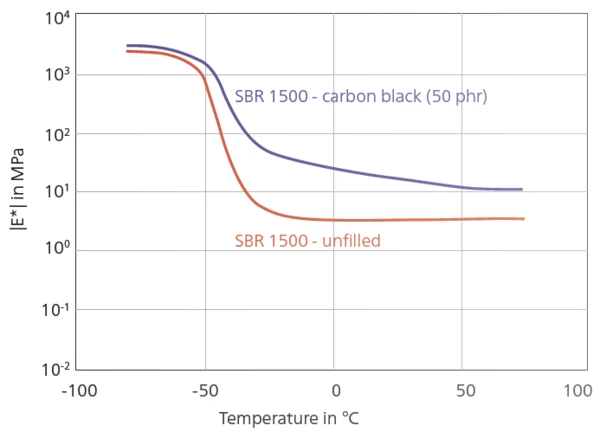
Las figuras 4 y 5 muestran el Módulo complejoEl módulo complejo consta de dos componentes, el módulo de almacenamiento y el módulo de pérdida. El módulo de almacenamiento (o módulo de Young) describe la rigidez y el módulo de pérdida describe el comportamiento de amortiguación (o viscoelástico) de la muestra correspondiente utilizando el método del Análisis Mecánico Dinámico (AMD). módulo complejo y tanδ del segundo sistema investigado. De nuevo, se caracterizó un sistema relleno y otro sin relleno, pero esta vez basado en SBR 1500. El SBR puro presenta un pico de transición vítrea mucho más estrecho que el sistema BR. Al igual que antes, los valores absolutos del Módulo complejoEl módulo complejo consta de dos componentes, el módulo de almacenamiento y el módulo de pérdida. El módulo de almacenamiento (o módulo de Young) describe la rigidez y el módulo de pérdida describe el comportamiento de amortiguación (o viscoelástico) de la muestra correspondiente utilizando el método del Análisis Mecánico Dinámico (AMD). módulo complejo [E*] del SBR sin relleno descienden desde casi 3.000 MPa por debajo de la Tg hasta valores inferiores a 5 MPa por encima de la Tg. El [E*] de los sistemas rellenos es -a temperaturas superiores a la Tg- el doble que el del SBR 1500 sin relleno.
Insertar texto
Barridos de frecuencia realizados en sistemas de caucho con y sin relleno
La figura 6 muestra la dependencia de la frecuencia de los dos sistemas de caucho butílico. El Módulo complejoEl módulo complejo consta de dos componentes, el módulo de almacenamiento y el módulo de pérdida. El módulo de almacenamiento (o módulo de Young) describe la rigidez y el módulo de pérdida describe el comportamiento de amortiguación (o viscoelástico) de la muestra correspondiente utilizando el método del Análisis Mecánico Dinámico (AMD). módulo complejo (E*, mostrado como valores absolutos) del sistema relleno (BR - 50 phr a 23°C) se desplaza simplemente a un nivel superior que el del BR sin relleno (BR - sin relleno a 23°C). A temperatura ambiente, las formas de línea de los compuestos BR rellenos (BR - 50 phr a 23°C) y sin rellenar (BR - sin rellenar a 23°C) son muy similares, lo que indica el mismo comportamiento de frecuencia para los cauchos rellenos y sin rellenar.
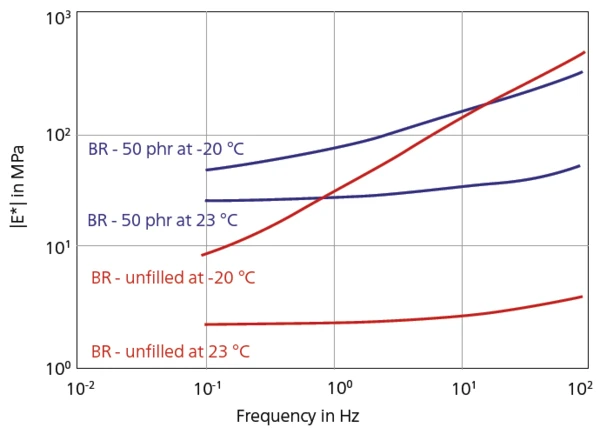
Dentro de la región de transición vítrea a una temperatura de T = -20°C, la situación es muy diferente. El BR sin relleno presenta una pendiente mucho mayor de la curva [E*] con el aumento de la frecuencia que el sistema relleno.
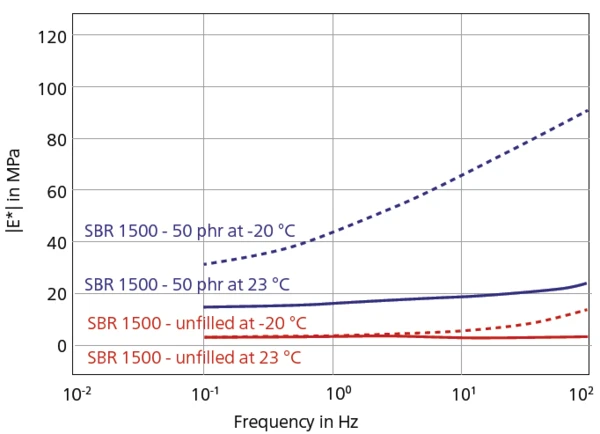
Se pueden obtener resultados similares para los sistemas SBR 1500 con y sin relleno (figura 7). Como era de esperar, el sistema relleno (SBR 1500 - 50 phr a 23°C) muestra en general valores más altos para el Módulo complejoEl módulo complejo consta de dos componentes, el módulo de almacenamiento y el módulo de pérdida. El módulo de almacenamiento (o módulo de Young) describe la rigidez y el módulo de pérdida describe el comportamiento de amortiguación (o viscoelástico) de la muestra correspondiente utilizando el método del Análisis Mecánico Dinámico (AMD). módulo complejo [E*] que el no relleno (SBR 1500 - no relleno a 23°C). La pendiente de las dos curvas a temperatura ambiente no difiere mucho. De nuevo, a -20°C, se pueden detectar diferencias en la forma de la línea large, que permiten distinguir entre diferentes contenidos de relleno analizando los valores absolutos de E*, como se ha comentado anteriormente.
Resumen
Large las muestras de caucho (de 10 mm de diámetro) sólo pueden investigarse en modo de compresión utilizando instrumentos de DMA de alta fuerza, como el Eplexor® 500 N de NETZSCH GABO Instruments.
La pregunta de en qué medida E* es función del contenido de Negro de humoLa temperatura y la atmósfera (gas de purga) afectan a los resultados del cambio de masa. Al cambiar la atmósfera de, por ejemplo, nitrógeno a aire durante la medición TGA, la separación y cuantificación de aditivos, por ejemplo, negro de carbono, y el polímero a granel puede llegar a ser posible.negro de humo puede responderse con barridos de frecuencia realizados en equilibrio térmico a diferentes temperaturas. Debido al principio de superposición tiempo-temperatura o frecuencia-temperatura, la variación de la frecuencia manteniendo una temperatura constante puede suministrar la misma información que un barrido de temperatura.
Normalmente, un barrido de frecuencia sólo requiere unos 5 minutos, lo que acelera drásticamente el procedimiento de ensayo con respecto a los barridos de temperatura convencionales, que duran unas 2 horas.
Los resultados de la prueba también muestran que los barridos de frecuencia realizados cerca de la Tg permiten distinguir materiales de caucho con distintos contenidos de Negro de humoLa temperatura y la atmósfera (gas de purga) afectan a los resultados del cambio de masa. Al cambiar la atmósfera de, por ejemplo, nitrógeno a aire durante la medición TGA, la separación y cuantificación de aditivos, por ejemplo, negro de carbono, y el polímero a granel puede llegar a ser posible.negro de humo mediante un análisis bastante rápido.