Introduction
La paille est un terme générique désignant les tiges de céréales battues et séchées et les feuilles des plantes utilisées pour produire des huiles et des fibres. Outre son utilisation dans l'agriculture, la paille a également le potentiel de devenir un vecteur énergétiqueneutre en CO2 à l'avenir. C'est une excellente forme de biomasse car c'est un sous-produit de l'agriculture. Contrairement à d'autres biocarburants, sa culture ne nécessite pas de mesures particulières ni de terres supplémentaires. Les cendres volantes issues du processus de combustion peuvent en outre être utilisées comme engrais pour les exploitations agricoles locales.
L'analyse thermogravimétrique (TGA) ou l'analyse thermique simultanée (STA), qui se réfère à la TGA et à la calorimétrie différentielle à balayage (DSC) simultanées, sont particulièrement adaptées à l'étude des processus de PyrolyseLa pyrolyse est la décomposition thermique de composés organiques dans une atmosphère inerte.pyrolyse ou de combustion. Il est possible d'obtenir rapidement des informations sur la Stabilité thermiqueUn matériau est thermiquement stable s'il ne se décompose pas sous l'influence de la température. Une façon de déterminer la stabilité thermique d'une substance est d'utiliser un ATG (analyseur thermogravimétrique). stabilité thermique de la plupart des combustibles solides en termes de températures de réaction et de cinétique de combustion. En outre, la perte de masse au cours de la PyrolyseLa pyrolyse est la décomposition thermique de composés organiques dans une atmosphère inerte.pyrolyse ou de la combustion et la Teneur en cendresLes cendres sont une mesure de la teneur en oxydes minéraux sur une base pondérale. L'analyse thermogravimétrique (ATG) en atmosphère oxydante est une méthode éprouvée pour déterminer le résidu inorganique, communément appelé cendre, dans les matériaux organiques tels que les polymères, les caoutchoucs, etc. Par conséquent, la mesure AGT Identify permet de déterminer si un matériau est chargé et de calculer la teneur totale en charge.teneur en cendres peuvent être quantifiées.
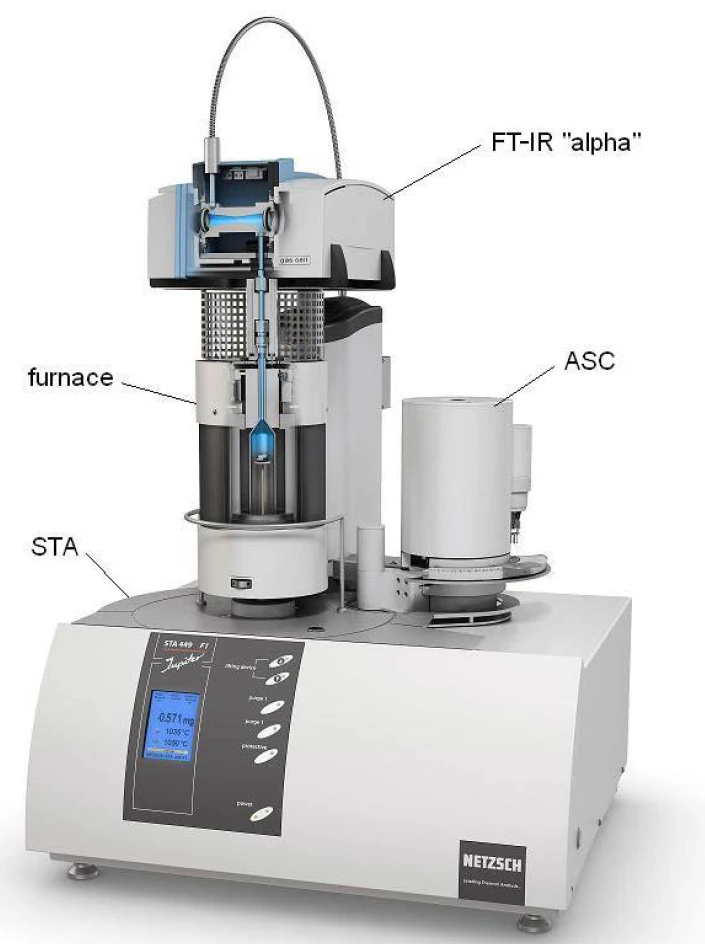
La mesure décrite ici examine le comportement de Réaction de décompositionUne réaction de décomposition est une réaction thermiquement induite d'un composé chimique formant des produits solides et/ou gazeux. décomposition de la paille [1]. Les gaz dégagés lors de la Réaction de décompositionUne réaction de décomposition est une réaction thermiquement induite d'un composé chimique formant des produits solides et/ou gazeux. décomposition sont identifiés par spectroscopie FT-IR à l'aide du système de couplage STA-FT-IR entièrement intégré NETZSCH Perseus STA 449 (voir figure 1).
Résultats des mesures
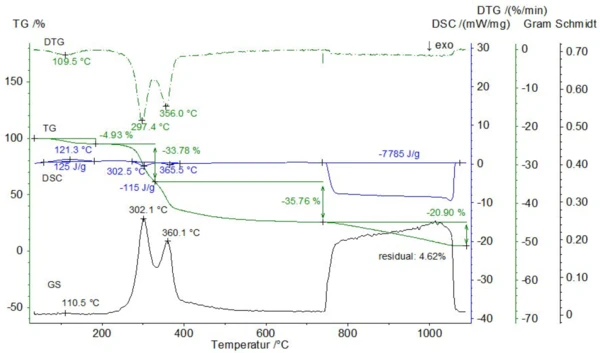
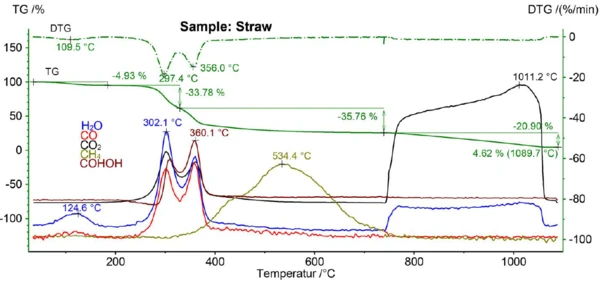
Un échantillon de paille en poudre d'origine inconnue d'une masse initiale de 28,64 mg a été mesuré dans un creuset en platine avec couvercle percé à une vitesse de chauffage de 20 K/min. L'atmosphère gazeuse est passée de l'azote pur à l'air à 740°C (les débits de gaz étaient de 70 ml/min). En dessous de 740°C, trois étapes de perte de masse de 4,9%, 33,8% et 35,8% se sont produites, accompagnées d'un effet EndothermiqueUne transition d'échantillon ou une réaction est endothermique si la conversion nécessite de la chaleur.endothermique et de deux effets exothermiques se chevauchant avec des enthalpies de 125 J/g et -115 J/g (voir figure 2). Au cours de ces étapes de perte de masse, le signal de Gram-Schmidt, qui reflète la somme de toutes les absorbances FT-IR pour toutes les longueurs d'onde, a montré des maxima à 111°C, 302°C et 360°C, ce qui correspond bien à la courbe DTG. Une autre étape de perte de masse de 20,9 % ainsi qu'un effet ExothermiqueUne transition d'échantillon ou une réaction est exothermique si elle produit de la chaleur.exothermique avec une enthalpie totale de -7,79 kJ/g se sont produits après le passage à l'air à 740°C. Ces effets sont dus à la combustion de la suie dite pyrolytique, laissant une masse résiduelle de 4,6 %, qui reflète la Teneur en cendresLes cendres sont une mesure de la teneur en oxydes minéraux sur une base pondérale. L'analyse thermogravimétrique (ATG) en atmosphère oxydante est une méthode éprouvée pour déterminer le résidu inorganique, communément appelé cendre, dans les matériaux organiques tels que les polymères, les caoutchoucs, etc. Par conséquent, la mesure AGT Identify permet de déterminer si un matériau est chargé et de calculer la teneur totale en charge.teneur en cendres.
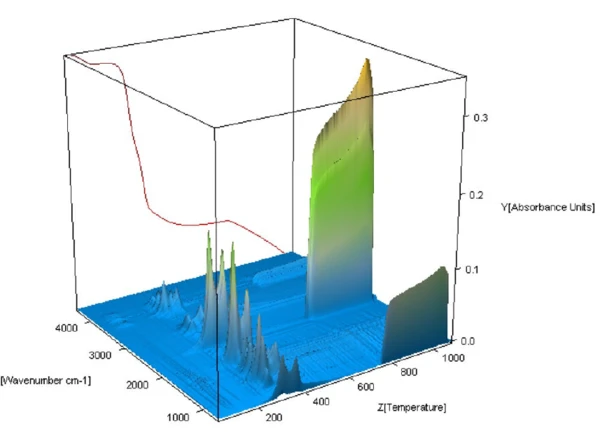
La figure 3 montre la vue 3D des spectres FT-IR des gaz dégagés recueillis tout au long de la Réaction de décompositionUne réaction de décomposition est une réaction thermiquement induite d'un composé chimique formant des produits solides et/ou gazeux. décomposition de la paille. Les spectres inférieurs à 740°C, qui correspondent à la PyrolyseLa pyrolyse est la décomposition thermique de composés organiques dans une atmosphère inerte.pyrolyse de l'échantillon, sont particulièrement intéressants. La forte absorbance FT-IR à des températures plus élevées est due à la libération deCO2 à la suite de la combustion.
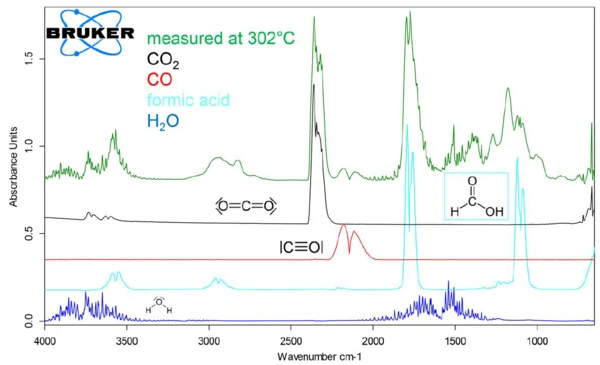
Les espèces gazeuses dégagées ont été identifiées en comparant les spectres 2D extraits à des températures spécifiques avec les spectres de la bibliothèque. Par exemple, la figure 4 montre que le spectre des gaz dégagés à 302°C correspond à un mélange contenant duCO2, du CO, duH2Oet de l'acide formique (HCOOH). L'évolution des espèces gazeuses individuelles au cours de la Réaction de décompositionUne réaction de décomposition est une réaction thermiquement induite d'un composé chimique formant des produits solides et/ou gazeux. décomposition de l'échantillon peut être retracée en intégrant une gamme caractéristique d'absorbance FT-IR pour les molécules et en superposant la courbe des valeurs d'intégration en fonction de la température avec les courbes TGA et DTG de l'analyse. La plage entre 2200 et 2450 cm-1 a été intégrée pour leCO2, entre 1950 et 2150 cm-1 pour le CO, entre 1300 et 1600 cm-1 pourH2Oet entre 1000-1150 cm-1 pour HCOOH.
Comme le montre la figure 5,H2Oa été libéré au cours de lapremière étape de perte de masse (évaporation de l'humidité) et au cours desdeuxième ettroisième étapes de perte de masse (PyrolyseLa pyrolyse est la décomposition thermique de composés organiques dans une atmosphère inerte.pyrolyse), au cours desquelles du CO, duCO2 et du HCOOH ont également été dégagés. Le CH4 a été dégagé sur une large plage de température avec un maximum à 534°C et leCO2 a été détecté à nouveau au-dessus de 740°C à la suite de la combustion de l'échantillon dans l'air.
Conclusion
L'utilisation du système de couplage STA-FT-IR très compact NETZSCH Perseus STA 449 pour caractériser la PyrolyseLa pyrolyse est la décomposition thermique de composés organiques dans une atmosphère inerte.pyrolyse et la combustion de la paille [1] a été démontrée. Une bonne corrélation entre les étapes de perte de masse détectées et l'évolution des gaz a été observée, démontrant l'avantage d'une interface de couplage directe. L'identification des gaz dégagés au moyen d'une recherche dans la base de données permet une interprétation détaillée de la chimie impliquée dans les étapes de perte de masse associées à la PyrolyseLa pyrolyse est la décomposition thermique de composés organiques dans une atmosphère inerte.pyrolyse, en particulier.