Introduction
Insulation materials play a key role in facade construction in the building industry: They reduce the transfer of heat, cold, sound, and, in some cases, moisture between indoor and outdoor areas. This reduces a building‘s energy consumption, keeps the indoor climate more stable, and significantly increases living comfort.
What are insulation materials used for?
- Thermal insulation: Minimizes heat loss in winter and prevents overheating in summer
- Moisture protection: Certain materials regulate moistre and prevent condensation
- Sound insulation: Insulating materials reduce airborne and impact sound
- Fire protection: Some insulation materials act as a barrier against fire or delay its spread.
Insulation materials significantly contribute to energy efficiency, sound and moisture protection, and fire safety of buildings. In addition to thermal performance, fire behavior is becoming increasingly important, as it has a significant impact on the spread of fire, smoke development, and evacuation safety.
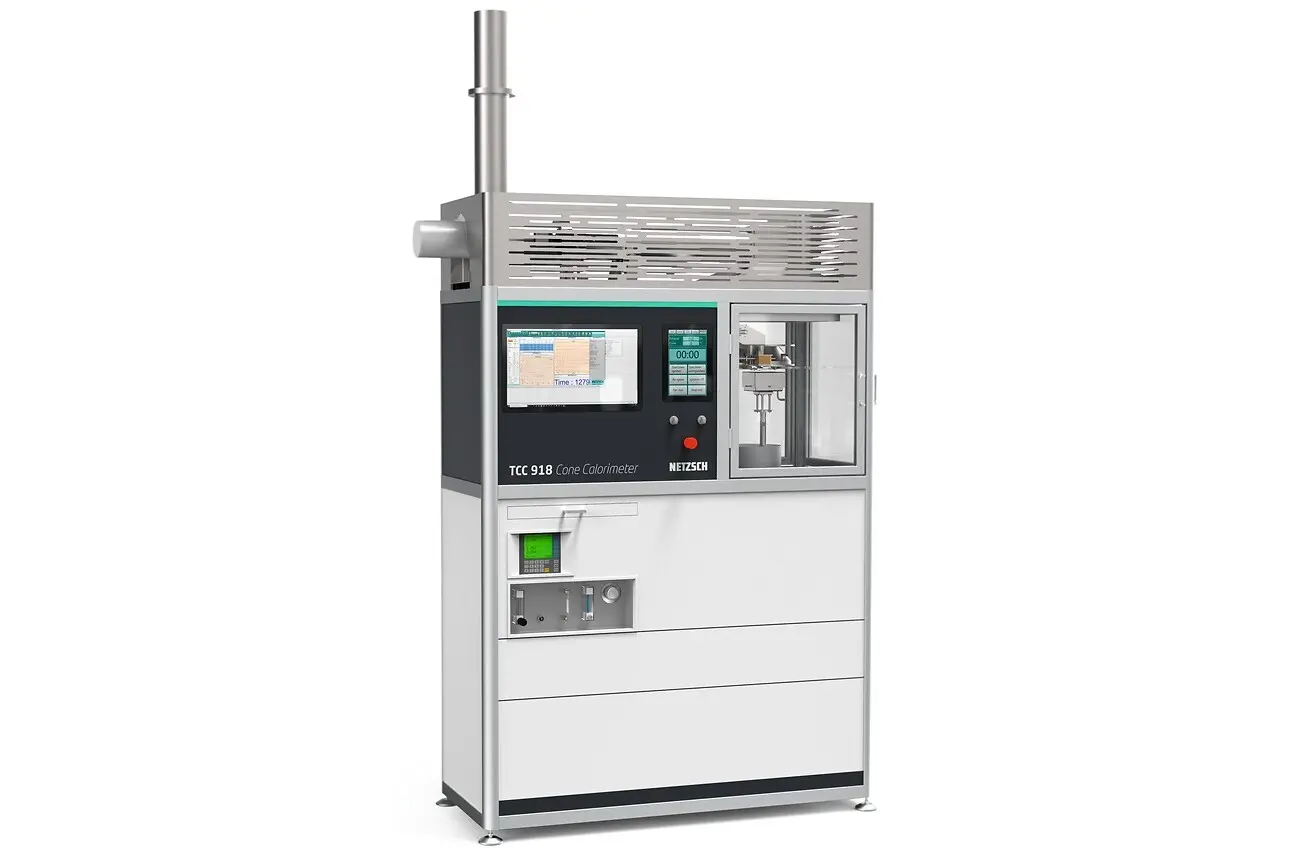
The TCC 918 Cone Calorimeter (figure 1) according to ISO 5660-1 is an established test method for the quantitative evaluation of the fire behavior of materials under defined heat effects.
In this Application Note, various insulation material variants are tested and compared using the NETZSCH TCC 918 Cone Calorimeter.
Measurement Conditions
Five insulation variants with different formulations and colours (white, red and three shades of grey) were tested in the TCC 918 Cone Calorimeter to investigate fire behaviour.
This device records various parameters, including the heat release rate (HRR), time to ignition (TOI) and total smoke production (TSP). It also enables predictions to be made about fire development.
All tests were carried out under identical conditions in accordance with ISO 5660-1 to ensure direct and meaningful comparability.
Each of the investigated insulation materials (figure 2) was repeatedly measured using individual samples.

The scope of the tests is detailed in table 1 and the measurement conditions are listed in table 2. Each sample of the various insulating materials was measured independently and under identical conditions.
The environmental conditions in the laboratory remained stable throughout the entire test series with an approximate temperature of 24 to 25°C and a relative humidity of 22 to 23%.
Table 1: Scope of the test samples
| Manufacturer ID | Color | Number of measured samples |
|---|---|---|
| Sample W | white | 4 |
| Sample R | red | 3 |
| Sample G4 | gray1 | 3 |
| Sample G5 | gray2 | 3 |
| Sample G6 | gray2 | 3 |
Table 2: Measurement conditions
| Sample holder | Horizontal |
| Heat flow | 25kW/m2 |
| Nominal flow rate | 24.0 l/s |
| Distance to the cone heater | 25 mm |
Measurement Results and Comparative Overviews
All conclusions presented in this section are based exclusively on the results of the individual samples measured.
Ignition Behavior
The Time of Ignition (TOI1) evaluates how quickly a material ignites when exposed to a defined level of heat. The sample was exposed to constant heat radiation of 25 kW/m². The time span from the start of irradiation to the first visible appearance of flames is defined as the ignition time. This timestamp is directly shown in the evaluation of the Cone Calorimeter software as TOI value.
A short ignition time indicates that the material is highly flammable and absorbs energy and heats up quickly, resulting in early ignition of the gaseous PyrolysisPyrolysis is the thermal decomposition of organic compounds in an inert atmosphere.pyrolysis products. More flame-resistant materials require more energy to heat up and undergo PyrolysisPyrolysis is the thermal decomposition of organic compounds in an inert atmosphere.pyrolysis, resulting in a delayed ignition.
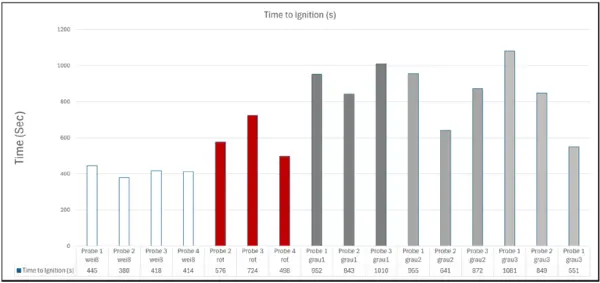
Across all the materials tested, there is clear and consistent differentiation in ignition behaviour. A comparison can be found in figure 3.
- The white variant of the samples investigated has the shortest ignition times and thus the lowest resistance to heat radiation. This results in an average ignition time of 414 s.
- The red variant has average ignition resistance, igniting later than the white variant but earlier than the grey variants. The average ignition time here is 599 s.
- The gray variants consistently show the longest ignition times. The calculated average ignition time is 862 s, indicating increased resistance to the applied heat flow.
This means that the gray materials show the highest resistance to the applied heat radiation.
1Thetime to ignition (TOI) defines how quickly flaming combustion occurs in a material. (NTA_Cone_Calorimeter_en_web.pdf, p. 7).
Heat Release Intenstiy and Fire Development
The heat release rate (HRR2) is one of the key parameters used to assess fire intensity. It is considered the driving force behind a fire: the higher the HRR, the greater the flammability and potential fire hazard.
The peak heat release rate (peak HRR) indicates the moment when a material releases the most heat, which is particularly dangerous in an emergency as it contributes to the spread of fire quickly and intensely.
Peak HRR enables clear and simple comparisons to be made between different materials and formulations.
Figures 4 to 6 show the heat release rate measurement curves for different insulation materials.
2Theheat release rate (HRR) is a measure of the amount of heat released per unit of time during the combustion of a material. (NTA_Fire_Testing_Systems_en_web.pdf p. 6)
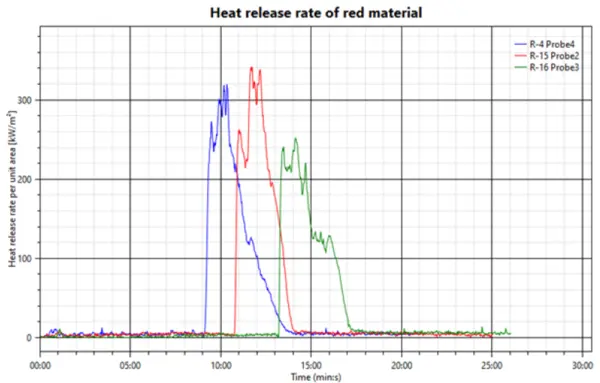
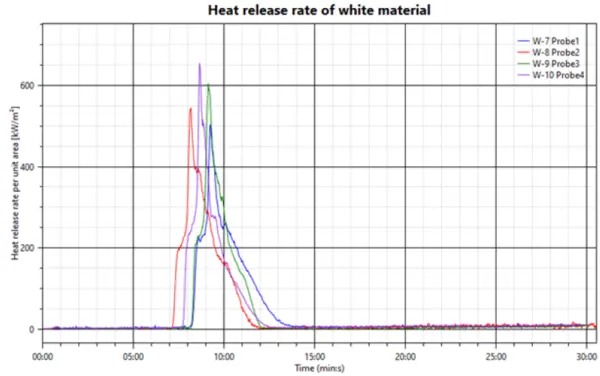
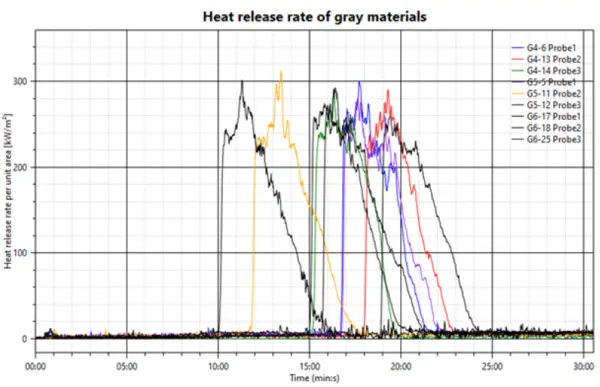
Table 3 shows the maximum heat release rates (peakHRR3) of the various insulation materials.
To improve comparability, the mean peak HRR values for each material variant were calculated.
The following conclusions can be drawn from the results:
- white variant: approx. 572 kW/m² → very high fire intensity
- red variant: approx. 306 kW/m² → average to very high fire intensity
- gray variants: approx. 289 kW/m² → average fire intensity
Thus, the white materials show the most intense heat release after ignition, while the grey variants are characterised by lower peak HRR values.
3Peak-HRR– Maximum heat release rate (NTA_Fire_Testing_Systems_de_web.pdf S.6)
Table 3: Comparison of the peak HRR
| group ID | Color | Peak-HRR Values (kW/m²) | Peak-HRR Range (kW/m²) | Mean Peak-HRR (kW/m²) | Observed Fire Intensity |
|---|---|---|---|---|---|
| Sample W | white | 496.2/548.3/596.9/647.4 | 496-647 | 572.2 | Very high |
| Sample R | red | 345,4 / 252,9 / 319,2 | 254-345 | 305.8 | Average to high |
| Sample G4 | gray1 | 301.1/282.6/294.8 | 283-301 | 292.8 | Average |
| Sample G5 | gray2 | 283.1/309.4/ 295.6 | 283-309 | 269.0 | Average |
| Sample G6 | gray2 | 258.7/272.3/304.8 | 259-305 | 278.6 | Average |
Fire Growth Intensity
The maximum average heat release rate (MARHE4) illustrates differences in fire growth intensity as it represents the time-smoothed maximum heat release during the test, making it possible to compare the fire behaviour of different materials.
Figure 7 shows the MARHE values (maximum average rate of heat emission) of the different material samples, differentiated by colour: white, red and grey. The values are shown as vertical bars, with the corresponding sample designation below each bar. The MARHE values indicate the maximum average heat release during the entire fire test.
4MARHE– Value, (Max. Average Rate of Heat Emission) is the maximum heat release rate determined during a test with the Cone Calorimeter according to ISO 5660-1.
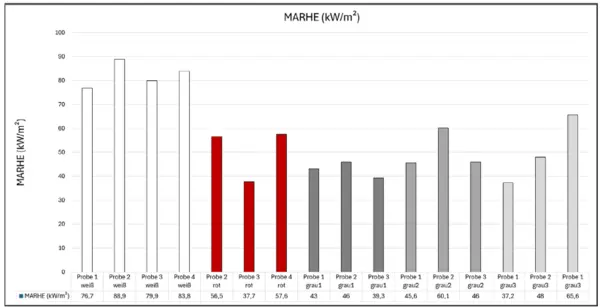
Interpretation
- Samples of the white category predominantly show MARHE values, ranging from 76.7 kW/m² to 90 kW/m²
- Several samples show values above 80 kW/m², two of them even close to 90 kW/m².
→ The white materials have the highest MARHE values, representing the most critical fire behavior, which corresponds to the high peak HRR values and indicates rapid fire development.
- Samples of the red category are in the middle range and show significant variations: Values: 56.5 kW/m², 37.7 kW/m², 57.6 kW/m².
→ The red samples demonstrate moderately high fire behavior, with some variation from sample to sample.
- Samples of the gray category mostly have the lowest MARHE values, but there are also two outliers.
- The main range is between 39 and 60 kW/m².
→ The grey samples mostly have the lowest MARHE values, indicating more controlled fire growth.
Smoke Development
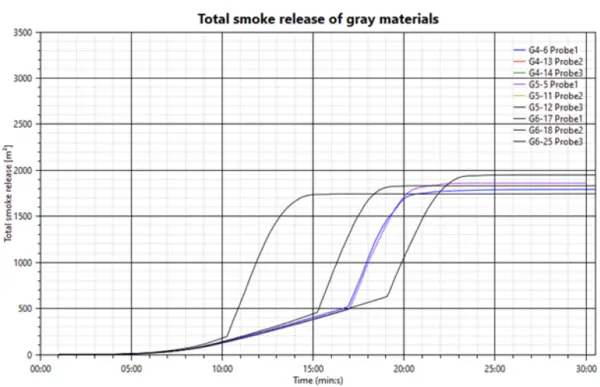
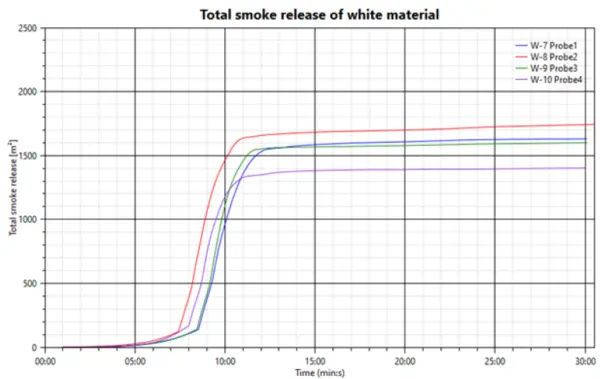
The total smoke development (TSP5) describes the total amount of smoke released during the cone calorimeter test according to ISO 5660-1, and is a key parameter for assessing smoke behavior.
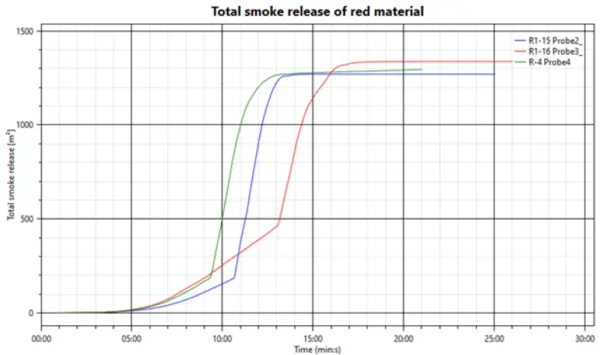
Total smoke development differs significantly between the formulations (Figures 8 to 10).
- All gray materials reach their final plateau after approx. 25 minutes, delivering typical values between 1650 m² and 1950 m².
- The white materials demonstrate moderate total smoke production, with values ranging between 1450 m² and 1650 m². The final plateau is already reached after 15 minutes.
- The red variants exhibit the lowest total smoke production of all materials tested. The values reach their plateau after 18 minutes between 1290 m² and 1350 m².
5TotalSmoke Production (TSP) describes the total amount of smoke produced overe the entire duration of the fire (according to ISO 5660-1)
Summary
The measurements carried out with the TCC 918 Cone Calorimeter TCC 918 clearly show reproducible differences in the fire behavior of the insulating materials examined.
Quantitative parameters such as ignition time, heat release rate, fire growth intensity, and smoke development can be used to clearly characterize and directly compare flammability, fire dynamics, and smoke behavior.
The results clearly demonstrate the impact of various material formulations and offer a robust foundation for material development, formulation optimisation, and benchmarking in a controlled laboratory environment.