Introduction
Starch is a polysaccharide, composed of amylose and amylopectin, present in many comestible plants such as potatoes, wheat, rice, etc. In the pharmaceutical industry, it is used as a binder during compression of tablets and as a disintegrant as soon as the tablet is exposed to moisture. Starch also plays an important role in the food industry where it is used to act as a thickener and stabilizer in sauces and puddings. Similar to its use in the food industry, it can be used as an environmentally friendly adhesive in paper and wood processing. Starch-based adhesives react to moisture and temperature, which is beneficial in the packaging industry. Additionally, modified starch is used as a thickening agent in paints, coatings, and cosmetic products. The viscosity measurement using the RVA curve can help optimize flow properties for industrial applications.
When heated in a liquid, the starch granules swell and transform from a partially crystalline state into a gellike system. This process, called gelatinization, involves changes in the starch’s structure and flow properties. It can be simulated by studying the rheological behavior of starch under controlled temperature conditions. Also, the quality of the product is evaluated through relevant rheological parameters.
Measurement Conditions and Sample Holder– Especially for Starch Testing
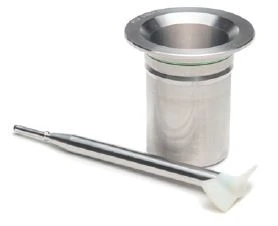
In the following, the influence of gelatinization on the shear viscosity of rice starch is investigated with the Kinexus rotational rheometer. To this end, a geometry dedicated to starch is used. It consists of a cup and a 2-blade mixing paddle (figure 1).
A sample, consisting of 3 g starch in 25 g water, was investigated. The measurement conditions are summarized in table 1. The selected temperature program is typical for testing and evaluating starch pasting characteristics. The resulting shear viscosity curve is known as an RVA curve (Rapid Visco-Analyzer curve).
Table 1: Measurement conditions
| Step | Temperature [°C] | Shear rate [s-1] | Time [s] |
|---|---|---|---|
| Pre-shear | 50 | 200 | 30 |
| 1 | 50 | 54 | 60 |
| 2 | 50 - 95, 6 K/min | 54 | - |
| 3 | 95 | 54 | 150 |
| 4 | 95 - 50, 6 K/min | 54 | - |
| 5 | 60 | 54 | 60 |
Measurement Results
Figure 2 shows a gelatinization curve of rice starch obtained according to the above testing method. At the beginning of the test, the temperature was gradually increased. Before reaching the gelatinization temperature, the starch was arranged in an orderly crystalline state and could not absorb water or swell. The viscosity curve did not change at all, and the viscosity remained constant.
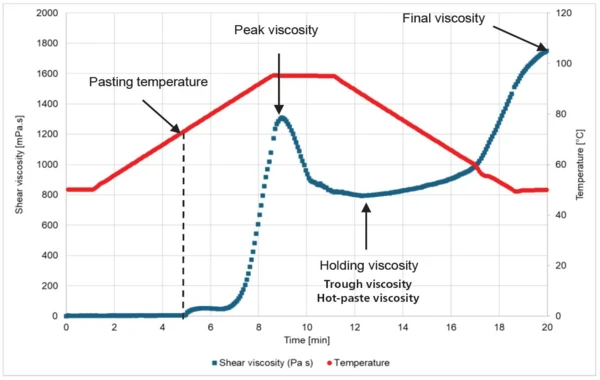
As the temperature continues to rise, the viscosity begins to increase. At this point, starch granules begin to gelatinize, crystals begin to be disrupted, and the original ordered structure is lost. The corresponding point in the temperature curve, called pasting temperature, generally depends on the ratio of amylose to amylopectin.
During further heating, the viscosity continues to increase. At a certain temperature, the viscosity reaches its peak maximum, called peak viscosity. Here, the starch particles absorb water and swell, expanding to the maximum extent. A low peak viscosity often indicates weak swelling ability of starch, making it more difficult to gelatinize or cook.
After the peak viscosity is exceeded, due to the complete water absorption and swelling of starch, it cannot further absorb water. Therefore, with the increase in time, under the action of strong stirring, the structure of starch paste is continuously destroyed, causing molecular chains to break. This results in a decrease in viscosity until it reaches a certain minimum value, which can also be called holding viscosity, trough viscosity or hot paste viscosity. It usually occurs at the end of the IsothermalTests at controlled and constant temperature are called isothermal.isothermal period or the beginning of the cooling. The destruction of the structure is related to the composition of starch.
The difference between the peak viscosity and the minimum viscosity is called the breakdown value, or disintegration value, which can be used to quantitatively evaluate the damage to starch structure. The disintegration of starch granules depends on the ratio of amylose to amylopectin, as well as many other factors such as the surface treatment of starch granules.
When the temperature drops back to the initial temperature, the viscosity returns to a higher viscosity level, which is caused by the recrystallization of linear starch during cooling, called retrogradation. This viscosity is called final viscosity or cold paste viscosity and can be used as an indicator to judge the consistency of texture or taste or aging rate.
The difference between the lowest viscosity and the final viscosity is called the setback viscosity. It is related to the recombination of linear starch during the cooling process and depends on the content of linear starch, the degree of swelling, and the disintegration of starch particles. The lower the retrogradation value, the softer the texture of the product made of this starch, and the slower the aging and hardening rate.
Conclusion
An RVA curve was measured with the Kinexus rotational rheometer to evaluate the pasting and retrogradation characteristics of rice starch. This type of measurement is particularly easy to perform with the Kinexus because the rSpace measurement and evaluation software contains a method specially dedicated to starch testing.
Interpretation and analysis of the resulting curve are used to predict and adjust product quality. The software also allows for the quantification of subjective human perception. For example, for a soft pastry, a higher peak viscosity suggests strong swelling, which makes the product softer and less chewy. A higher viscosity drop indicates a structure with weak stability under heat and shear StressStress is defined as a level of force applied on a sample with a well-defined cross section. (Stress = force/area). Samples having a circular or rectangular cross section can be compressed or stretched. Elastic materials like rubber can be stretched up to 5 to 10 times their original length.stress. A high final viscosity suggests higher retrogradation (amylose re-association), which can contribute to a firmer, chewier pastry.