Introduction
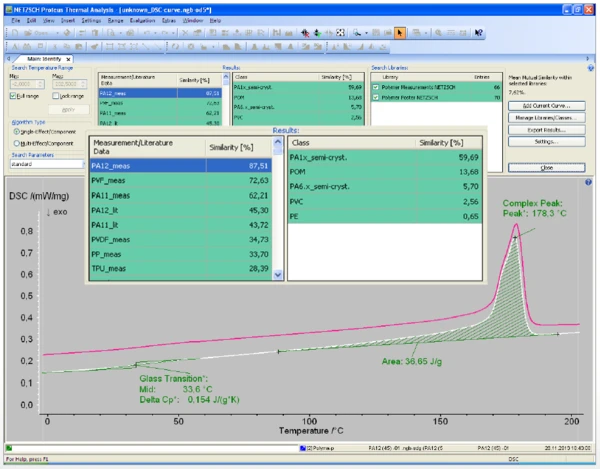
The benefits of using the Identify software to recognize unknown materials from their DSC curves and for quality control has been presented previously [1, 2]. One further exemplary case of material identification is illustrated in figure 1. After applying Identify to an unevaluated DSC curve, it was autonomously evaluated by the NETZSCH Proteus® software using AutoEvaluation, and the Identify results were immediately displayed. On the left side of the screen shot is a hit list that sorts materials within the database according to the similarity between their DSC curves and the curve of the unknown sample. On the right, a second hit list indicates the similarity between the “unknown” sample and defined classes that represent groups of measurements and literature data within the database.
In this example, the Glass Transition TemperatureThe glass transition is one of the most important properties of amorphous and semi-crystalline materials, e.g., inorganic glasses, amorphous metals, polymers, pharmaceuticals and food ingredients, etc., and describes the temperature region where the mechanical properties of the materials change from hard and brittle to more soft, deformable or rubbery.glass transition around 34°C and the melting peak around 178°C detected in the unknown DSC curve led to identification of the unkown as polymer PA12 belonging to the defined class “PA1x_semi-cryst.”.
The database of Identify currently contains two libraries with measurements and literature data from the wellknown NETZSCH poster “Thermophysical Properties of Polymers”. The purpose of this study was to determine if these 136 preinstalled entries in the database are sufficient to identify most unknown polymers encountered in a laboratory’s day-to-day business.
Analysis of 200 Unknown DSC Curves
A set of 200 different DSC measurements from the NETZSCH Applications laboratory in Selb, Germany was investigated by using the ‘automatic selection of algorithm type and search parameters’ mode of Identify. The measurements using the NETZSCH DSC models Maia, Phoenix® or Polyma had been performed on various samples from different projects and were of either unspecified or unknown composition. Most of the samples should have been polymers such as thermoplastics, thermosets or elastomers, polymer blends or composites.
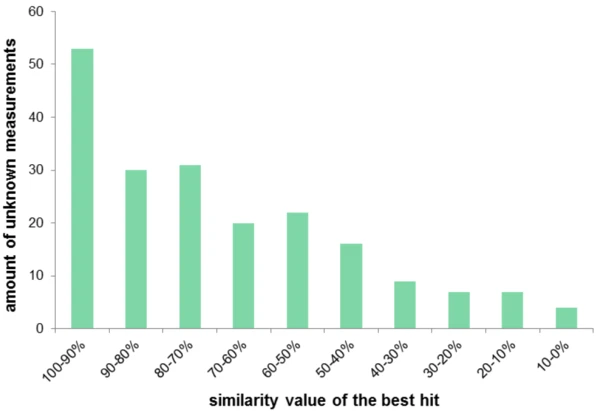
Figure 2 displays statistics for which the similarity values of the best hits of the Identify search results were collected for each of the 200 unknown DSC curves: in 53 cases, the best hit had a similarity in the range between 100% and 90%, in 30 cases in the range between 90% and 80%, in 31 cases in the range between 80% and 70%, and so on. this means that, in a lot of cases, very similar curves were found in the NETZSCH polymer libraries most probably leading to correct identification of the unknown DSC curve and thus of the unknown material.
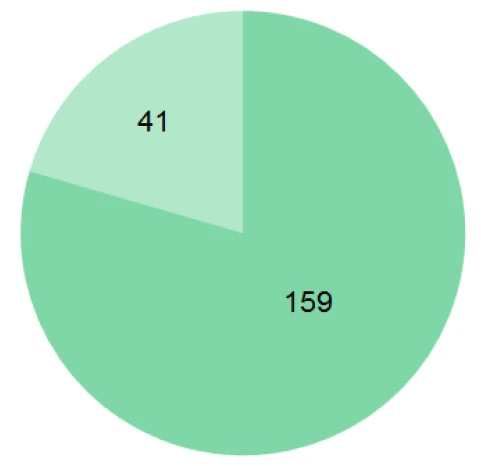
Unfortunately, a high hit quality does not guarantee the correct identification of an unknown DSC curve. On the one hand, it is challenging that multiple interpretations of a DSC curve are sometimes possible. Therefore, not only the best hit of the search results should be considered. It can happen, on the other hand, that the best hit has a relatively small similarity value – but the identification is correct (for example, see application sheet AS-247-2013). Such limitations, also existing in the field of MS and FT-IR spectroscopy, are typical for database search routines. All results were therefore again analyzed regarding the question: Do the DSC curves of the best hit and that of the unknown sample really look similar? Or, in other words: Is the best hit a reasonable and satifying search result which makes sense? This was the case in 159 of 200 cases or in 80% of all cases (see figure 3) which is very satisfying in light of the limited number of library entries. There are mainly two reasons for unsatisfying search results: Firstly, the measured temperature range of the unknown DSC curve is too small, complicating a successful identification. And secondly, there is just no similar DSC curve in the database. This was sometimes the case when the unknown DSC curve probably originated from a complex polymer blend or maybe not even from a polymer at all.
Conclusion
- The current NETZSCH polymer libraries of Identify containing 136 entries do cover most polymers encountered in an analysis and testing laboratory. Polymer blends having a superposition of features from all of the individual polymer components can also be successfully analyzed by means of Identify (for example, see application sheet AS-246-2013).
- The user can expand the database with libraries containing his own measurements. This will further adapt the capability of Identify to the user’s needs. Last but not least, NETZSCH will also expand the standard database of Identify in the future.