Introduction
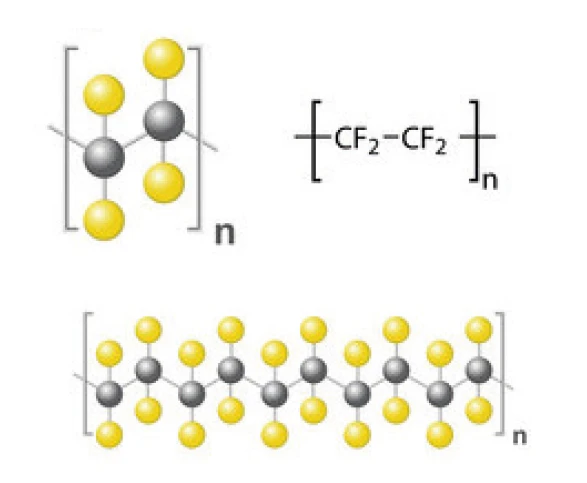
PTFE (polytetrafluoroethylene) is a polymer commonly known as Teflon. It has a helical linear structure, in which the fluorine atoms surround the carbon atoms and build a protective layer (see structure below). This explains its exceptional properties in terms of Thermal StabilityA material is thermally stable if it does not decompose under the influence of temperature. One way to determine the thermal stability of a substance is to use a TGA (thermogravimetric analyzer). thermal stability, insulation, chemical resistance, etc. [1].
The properties of PTFE are temperature-dependent and include those typical of semi-crystalline materials such as Glass Transition TemperatureThe glass transition is one of the most important properties of amorphous and semi-crystalline materials, e.g., inorganic glasses, amorphous metals, polymers, pharmaceuticals and food ingredients, etc., and describes the temperature region where the mechanical properties of the materials change from hard and brittle to more soft, deformable or rubbery.glass transition and melting. Moreover, its helical structure is thought to be responsible for the existence of crystal-crystal transitions around room temperature [2].
In the following, a PTFE sample was measured with DSC, DMA and rotational rheometry. These three methods go hand in hand: DSC provides information about the thermal properties of a material, DMA and rheometry offer the possibility to obtain (among others) the viscoelastic properties of the sample by evaluating the response to an oscillatory signal.
Some Definitions
DMA:
E*: Complex Elastic modulusThe complex modulus (elastic component), storage modulus, or G’, is the “real” part of the samples the overall complex modulus. This elastic component indicates the solid like, or in phase, response of the sample being measurement. elastic modulus
E': Storage modulus, elastic contribution to E*
E": Loss modulus, viscous contribution to E*
tan δ: Loss factor
Rheometry:
G*: Complex shear modulus
G': Storage shear modulus, elastic contribution to G*
G": Loss shear modulus, viscous contribution to G*
δ: Phase angle
DSC (Differential Scanning Calorimetry) – Functional Principle
DSC is a technique in which the difference between the heat-flow rate into a sample crucible and that into a reference crucible is derived as a function of time and/or temperature. During such measurement, sample and reference are subjected to the same controlled temperature program and a specified atmosphere.
Result: The thermal characteristics are determined, e.g., melting, CrystallizationCrystallization is the physical process of hardening during the formation and growth of crystals. During this process, heat of crystallization is released.crystallization, Glass Transition TemperatureThe glass transition is one of the most important properties of amorphous and semi-crystalline materials, e.g., inorganic glasses, amorphous metals, polymers, pharmaceuticals and food ingredients, etc., and describes the temperature region where the mechanical properties of the materials change from hard and brittle to more soft, deformable or rubbery.glass transition, degree of Crystallinity / Degree of CrystallinityCrystallinity refers to the degree of structural order of a solid. In a crystal, the arrangement of atoms or molecules is consistent and repetitive. Many materials such as glass ceramics and some polymers can be prepared in such a way as to produce a mixture of crystalline and amorphous regions.crystallinity, cross-linking reactions (Curing (Crosslinking Reactions)Literally translated, the term “crosslinking“ means “cross networking”. In the chemical context, it is used for reactions in which molecules are linked together by introducing covalent bonds and forming three-dimensional networks.curing)1.
DMA (Dynamic-Mechanical Analysis) – Functional Principle
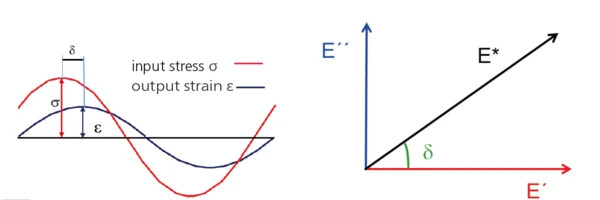
A sinusoidal force (StressStress is defined as a level of force applied on a sample with a well-defined cross section. (Stress = force/area). Samples having a circular or rectangular cross section can be compressed or stretched. Elastic materials like rubber can be stretched up to 5 to 10 times their original length.stress σ, input) is applied to the sample resulting in a sinusoidal deformation (StrainStrain describes a deformation of a material, which is loaded mechanically by an external force or stress. Rubber compounds show creep properties, if a static load is applied.strain ε, output).
The response signal (StrainStrain describes a deformation of a material, which is loaded mechanically by an external force or stress. Rubber compounds show creep properties, if a static load is applied.strain, ε) is split into an “in-phase” and an “out-of-phase” part.
The “in-phase” part is related to the elastic properties (→ E´, storage modulus), the “out-phase” part to the viscous properties (→ E”, Viscous modulusThe complex modulus (viscous component), loss modulus, or G’’, is the “imaginary” part of the samples the overall complex modulus. This viscous component indicates the liquid like, or out of phase, response of the sample being measurement. loss modulus) of the viscoelastic material.
Result: The viscoelastic properties of the sample are determined, in particular its Complex ModulusThe complex modulus consists of two components, the storage and the loss moduli. The storage modulus (or Young’s modulus) describes the stiffness and the loss modulus describes the damping (or viscoelastic) behavior of the corresponding sample using the method of Dynamic Mechanical Analysis (DMA). complex modulus E*2.
1 More information on Differential Scanning Calorimetry
2 More information on Dynamic-Mechanical Analysis
Rotational Rheometer (Oscillation Measurement) – Fundamental Principle
The upper geometry with a defined frequency f [Hz] (or ω [rad/s]) and amplitude [%] (or shear StrainStrain describes a deformation of a material, which is loaded mechanically by an external force or stress. Rubber compounds show creep properties, if a static load is applied.strain γ [%]).
The complex shear StressStress is defined as a level of force applied on a sample with a well-defined cross section. (Stress = force/area). Samples having a circular or rectangular cross section can be compressed or stretched. Elastic materials like rubber can be stretched up to 5 to 10 times their original length.stress σ* [Pa] required for this oscillation is determined and is split into an “in-phase” and an “out-of-phase” part.
The “in-phase” part is related to the elastic properties (→ G´, storage shear modulus), the “out-phase” part to the viscous properties (→ G”, loss shear modulus) of the visco-elastic material.
Result: The visco-elastic properties of the sample are determined, in particular its Complex Shear Modulus (G*)Shear modulus is a measurement of the stiffness of a material. complex shear modulus G* and its complex shear viscosity ŋ* [Pa·s]3:
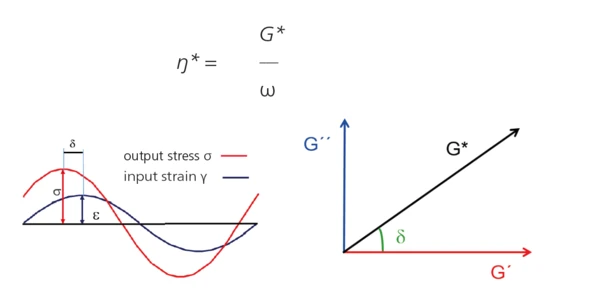
Table 1 summarizes the conditions of the three measurements.
Table 1: Test Conditions
| Method | DSC | DMA | Rotational Rheometry |
|---|---|---|---|
| Crucible/geometry | Concavus® (aluminum), closed with pierced lid | 3-point-bending, 40 mm | Torsion |
| Sample mass/dimensions | 11.88 mg | Length: 40 mm Width: 9.98 mm Height: 2.1 mm | Length: 42.5 mm Width: 10.01 mm Height: 2.09 mm |
| Temperature range | -70°C to 380°C | -170°C to 150°C | 5°C to 150°C |
| Heating rate | 10 K/min | 2 K/min | 1 K/min |
| Amplitude/shear StrainStrain describes a deformation of a material, which is loaded mechanically by an external force or stress. Rubber compounds show creep properties, if a static load is applied.strain | - | 60 μm | 4.10-3 %4 |
| Frequency | - | 1 Hz | 1 Hz |
| Atmosphere | Nitrogen (100 ml/min) | Air, static | Nitrogen (2 l/min) |
3 More information on Rheometry can be found at RHEOMETERS
4 A previous amplitude sweep test established an appropriate shear StrainStrain describes a deformation of a material, which is loaded mechanically by an external force or stress. Rubber compounds show creep properties, if a static load is applied.strain was applied ensuring the oscillatory measurements were non-destructive. During the complete frequency measurement, the StrainStrain describes a deformation of a material, which is loaded mechanically by an external force or stress. Rubber compounds show creep properties, if a static load is applied.strain remained in the linear visco-elastic range (Linear Viscoelastic Region (LVER)In the LVER, applied stresses are insufficient to cause structural breakdown (yielding) of the structure and hence important micro-structural properties are being measured.LVER) of the material, where StrainStrain describes a deformation of a material, which is loaded mechanically by an external force or stress. Rubber compounds show creep properties, if a static load is applied.strain and StressStress is defined as a level of force applied on a sample with a well-defined cross section. (Stress = force/area). Samples having a circular or rectangular cross section can be compressed or stretched. Elastic materials like rubber can be stretched up to 5 to 10 times their original length.stress are proportional.
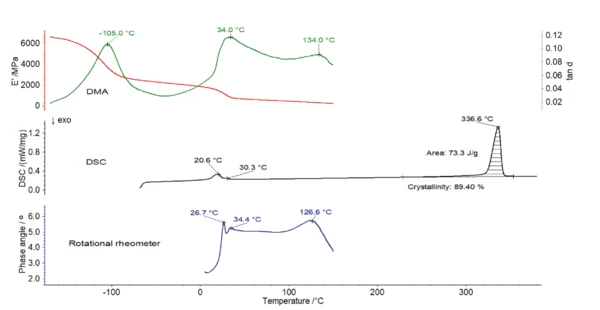
Figures 3 to 5 display the resulting curves of the DSC, DMA and rotational rheometer measurements.
Phase Transition in the Low-Temperature Range
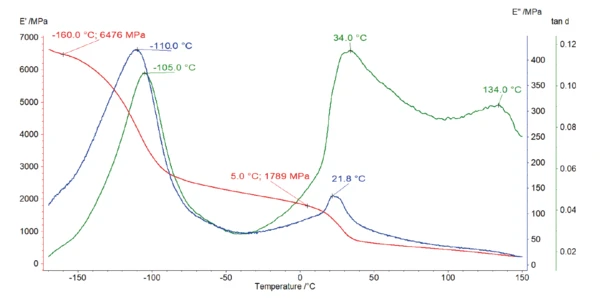
The DMA measurement (figure 3) shows that the Elastic modulusThe complex modulus (elastic component), storage modulus, or G’, is the “real” part of the samples the overall complex modulus. This elastic component indicates the solid like, or in phase, response of the sample being measurement. elastic modulus of the polymer amounts to almost 6500 MPa at -160°C. It decreases by more than half of its initial value during heating to -100°C. This strong decrease, associated with a peak at -110°C and -105°C in the curves of Viscous modulusThe complex modulus (viscous component), loss modulus, or G’’, is the “imaginary” part of the samples the overall complex modulus. This viscous component indicates the liquid like, or out of phase, response of the sample being measurement. loss modulus E” (blue) and loss factor tan δ (green), respectively, is most probably due to a structural change in the purely amorphous region and is called γ-RelaxationWhen a constant strain is applied to a rubber compound, the force necessary to maintain that strain is not constant but decreases with time; this behavior is known as stress relaxation. The process responsible for stress relaxation can be physical or chemical, and under normal conditions, both will occur at the same time. relaxation [3].
Crystal-Crystal Transitions around Room Temperature
The DSC measurement in figure 4 shows a peak at 21°C with a shoulder at 30°C. This is due to the two crystal-crystal transitions (from well-ordered to partially ordered hexagonal structure and from partially ordered to disordered structure) [4]. It corresponds to a drop in the E´ modulus, associated to a peak at 34°C in tan δ of the DMA measurement (figure 3).
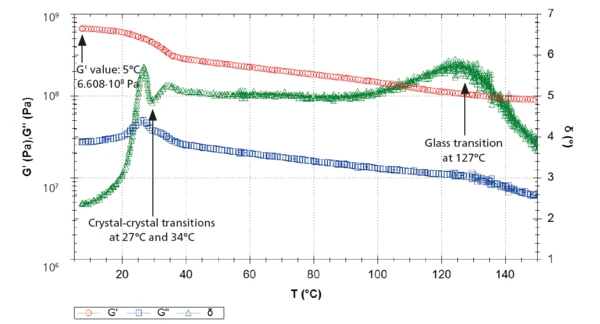
The measurement with the rotational rheometer is in agreement with these results (figure 5). The solid-solid transitions lead to a decrease of the G´ curve (red) as well as a double peak at 26-27°C and 33-34°C in the G" (blue) and in the δ curves (green).
Amorphous and Crystalline Regions: Glass Transition and Melting
An additional peak was detected at 134°C in the loss factor, tan δ, curve (figure 3) and at 127°C in the phase angle, δ, curve (figure 5). This corresponds to the Glass Transition TemperatureThe glass transition is one of the most important properties of amorphous and semi-crystalline materials, e.g., inorganic glasses, amorphous metals, polymers, pharmaceuticals and food ingredients, etc., and describes the temperature region where the mechanical properties of the materials change from hard and brittle to more soft, deformable or rubbery.glass transition of PTFE, during which the amorphous part of the polymer changes from a glassy to a rubbery state.
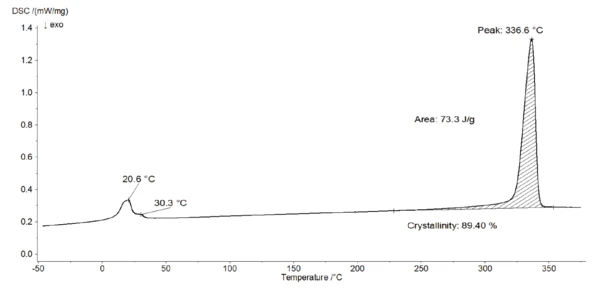
Furthermore, the EndothermicA sample transition or a reaction is endothermic if heat is needed for the conversion.endothermic peak detected at 337°C (figure 4) is due to the melting of the crystalline phase of PTFE [4]. The evaluation of the melting enthalpy (73 J/g) enables the determination of the degree of Crystallinity / Degree of CrystallinityCrystallinity refers to the degree of structural order of a solid. In a crystal, the arrangement of atoms or molecules is consistent and repetitive. Many materials such as glass ceramics and some polymers can be prepared in such a way as to produce a mixture of crystalline and amorphous regions.crystallinity of the material (see info box). This PTFE has a Crystallinity / Degree of CrystallinityCrystallinity refers to the degree of structural order of a solid. In a crystal, the arrangement of atoms or molecules is consistent and repetitive. Many materials such as glass ceramics and some polymers can be prepared in such a way as to produce a mixture of crystalline and amorphous regions.crystallinity of almost 90%. In turn, the amorphous phase amounts only 10% of the sample. This means that the amorphous part of the polymer is only weakly pronounced.
The detection of this very weak Glass Transition TemperatureThe glass transition is one of the most important properties of amorphous and semi-crystalline materials, e.g., inorganic glasses, amorphous metals, polymers, pharmaceuticals and food ingredients, etc., and describes the temperature region where the mechanical properties of the materials change from hard and brittle to more soft, deformable or rubbery.glass transition is not possible with the DSC, but alternative methods of DMA and rotational rheometry may be more suitable where a peak relating to the Glass Transition TemperatureThe glass transition is one of the most important properties of amorphous and semi-crystalline materials, e.g., inorganic glasses, amorphous metals, polymers, pharmaceuticals and food ingredients, etc., and describes the temperature region where the mechanical properties of the materials change from hard and brittle to more soft, deformable or rubbery.glass transition temperature is very distinct in both curves of loss factor (peak temperature at 134°C) and phase angle (peak temperature at 127°C).
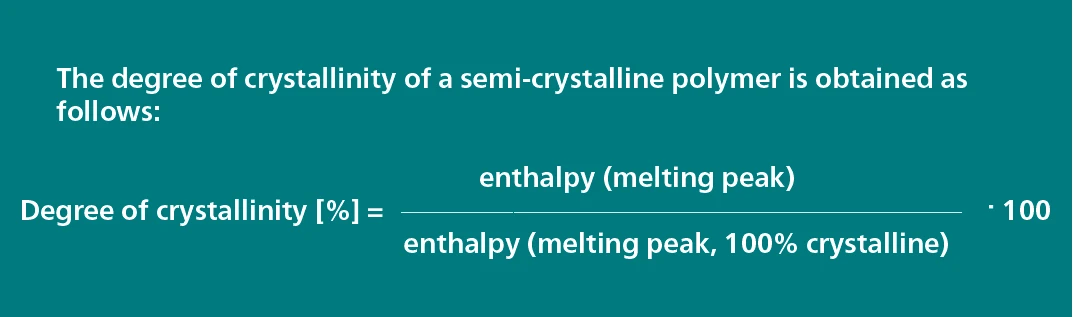
Figure 6 depicts the curves obtained with the three methods. In the temperature range up to 150°C, the loss factor of the DMA measurement as well as the phase angle of the rotational rheometer test clearly reveal the Glass Transition TemperatureThe glass transition is one of the most important properties of amorphous and semi-crystalline materials, e.g., inorganic glasses, amorphous metals, polymers, pharmaceuticals and food ingredients, etc., and describes the temperature region where the mechanical properties of the materials change from hard and brittle to more soft, deformable or rubbery.glass transition temperature of this highly crystalline PTFE sample.
How to Link E’ and G’? Complex Methods – Simple Answer
As noticed previously (see 4 on page 2), the applied deformations were in the linear visco-elastic range of the material. In this case, the Elastic modulusThe complex modulus (elastic component), storage modulus, or G’, is the “real” part of the samples the overall complex modulus. This elastic component indicates the solid like, or in phase, response of the sample being measurement. elastic modulus E' (DMA) and the elastic shear modulus G' are related by the following equation:
E' = 2 · G’ · (1 + n)
where n is Poisson's ratio and amounts to 0.42 for PTFE [5].
At 5°C → E´ = 1789 MPa
At 5°C → G´= 661 MPa
2 · G’ (1 + n) = 1876 MPa
The measured value of E´ is in good agreement with the value calculated from the relationship between storage modulus and Poisson's ratio.
Conclusion
DSC, DMA and rotational rheometry were performed on an unfilled PTFE material. All three methods identified the crystal-crystal transitions. The very weak glass transition was detected by means of DMA and rotational rheometry. In addition, a good correlation between Elastic modulusThe complex modulus (elastic component), storage modulus, or G’, is the “real” part of the samples the overall complex modulus. This elastic component indicates the solid like, or in phase, response of the sample being measurement. elastic modulus measured in the DMA and elastic shear modulus via rheometry was found.
The γ-transition, melting and degree of Crystallinity / Degree of CrystallinityCrystallinity refers to the degree of structural order of a solid. In a crystal, the arrangement of atoms or molecules is consistent and repetitive. Many materials such as glass ceramics and some polymers can be prepared in such a way as to produce a mixture of crystalline and amorphous regions.crystallinity were also characterized.
The combination of results using different methods not only ensures the validity of the results, but also increases the knowledge of the thermal and mechanical properties of the material.