Introduction

While analytical techniques such as EDX or ICP-MS provide a detailed analysis of chemical elements, e.g., of those occurring in a salt sample [1], methods of thermal analysis can be used to also identify and characterize different chemical compounds present in such a sample. Simultaneous thermal analysis (STA), which refers to thermogravimetry (TGA) and differential scanning calorimetry (DSC) simultaneously performed in one experiment, was, for example, employed to investigate cement raw materials including the presence and impact of alkali metal salt impurities [2]. Another example is the melting process and the Specific Heat Capacity (cp)Heat capacity is a material-specific physical quantity, determined by the amount of heat supplied to specimen, divided by the resulting temperature increase. The specific heat capacity is related to a unit mass of the specimen.specific heat capacity of the phase change material (PCM) sodium nitrate, NaNO3, which was studied by means of DSC [3].
This work deals with STA measurements on NaCl, KCl, usual table salt and so-called Himalayan salt where the melting, partial evaporation and compositional analysis of the salts are the focus. Alkali salts like NaCl (halite) and KCl (sylvite) play an important role in our day-to-day life. While NaCl is the main component in table or cooking salt, KCl can, for example, be used as road salt in winter. Himalayan salt originating from Pakistan is a natural salt that contains – along with NaCl – various minerals and oxides like Fe2O3 [1], which is responsible for the slightly pink color (see photo above).
Experimental
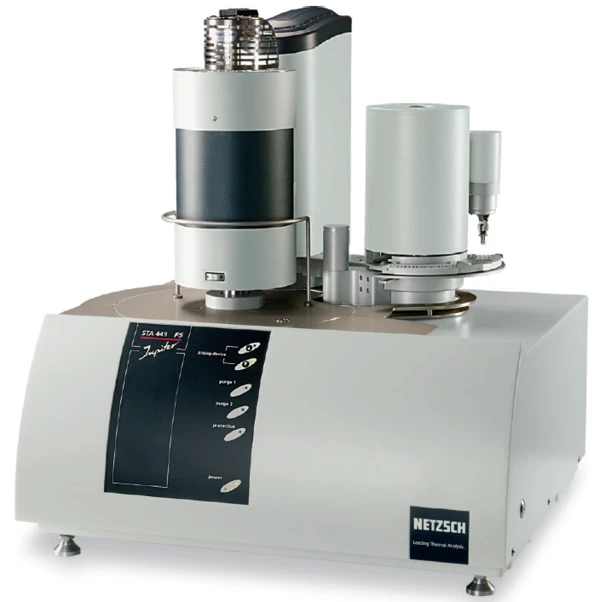
Measurements were carried out using the STA 449 F5 Jupiter® (see figure 1). This instrument, which has an SiC furnace allowing a maximum sample temperature of 1600°C, can optionally be equipped with the automatic sample changer (ASC) and coupling techniques for evolved gas analysis such as MS, FT-IR or GC-MS. The weighing range of the balance is as wide as 35 g with a balance resolution of 0.1 μg over the entire range. Another advantage of the STA 449 F5 Jupiter® is the TG-BeFlat® software functionality which automatically takes the buoyancy effect into account so that baseline measurements are no longer necessary for standard tests.
The measurement conditions applied for this work are summarized in table 1.
Table 1: Measurement conditions applied for this work
Measurement Conditions | |
|---|---|
| Instrument | STA 449 F5 Jupiter® |
| Sample carrier | TGA-DSC type S |
| Crucibles | PtRh (0.19 ml) |
| Heating Rate | 10 K/min |
| Sample masses | 23 ± 1 mg |
| Atmosphere | N2 |
| Purge gas flow rate | 70 ml/min |
Samples NaCl [4] and KCl [5] both had nominal purities of 99.8% whereas no information regarding the purity was available for the table salt and the Himalayan salt. All samples were measured as a thin layer of grains just covering the bottom of the crucible; the sample material was neither ground nor compacted.
Results and Discussion
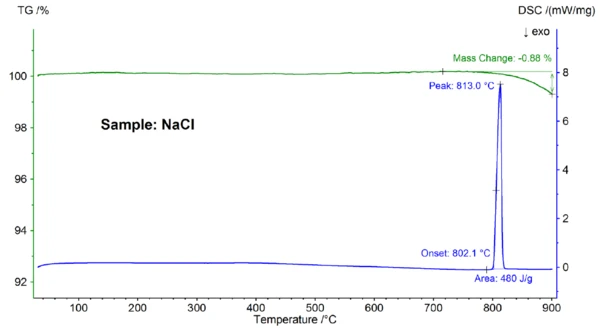
Depicted in figure 2 are the temperature-dependent mass change and heat flow rate of the NaCl sample. At an extrapolated onset temperature of 802.1°C, an EndothermicA sample transition or a reaction is endothermic if heat is needed for the conversion.endothermic effect with a peak temperature of 813°C and an enthalpy of 480 J/g was observed, which can be attributed to melting of the sample. The onset temperature, which reflects the Melting Temperatures and EnthalpiesThe enthalpy of fusion of a substance, also known as latent heat, is a measure of the energy input, typically heat, which is necessary to convert a substance from solid to liquid state. The melting point of a substance is the temperature at which it changes state from solid (crystalline) to liquid (isotropic melt).melting point, matches well with the literature value of 801°C; the enthalpy of 480 J/g is also in good agreement with the heat of fusion value of 484 J/g found in literature [6]. Above about 800°C, a mass loss of 0.9% occurred, which is due to partial evaporation of the sample.
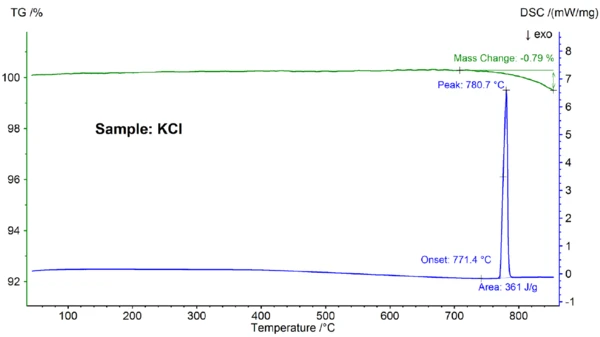
The STA results for the KCl sample are shown in figure 3. Again, melting and partial evaporation were observed; the Melting Temperatures and EnthalpiesThe enthalpy of fusion of a substance, also known as latent heat, is a measure of the energy input, typically heat, which is necessary to convert a substance from solid to liquid state. The melting point of a substance is the temperature at which it changes state from solid (crystalline) to liquid (isotropic melt).melting point, detected at 771.4°C, is in good agreement with the literature value of 772°C and the enthalpy value of 361 J/g is again in accordance with the value of 351 J/g reported in the reference [6].
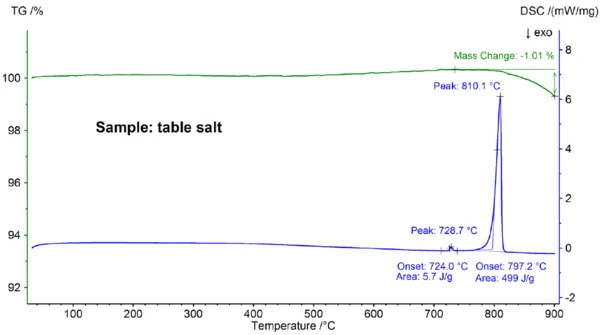
Displayed in figure 4 are the STA results obtained for the table salt sample, which clearly differ from the results obtained for the pure NaCl sample (compare figures 4 and 2): The onset of the main DSC peak is at 797.2°C and thus significantly below the value of 802.1°C observed for pure NaCl; also, an additional EndothermicA sample transition or a reaction is endothermic if heat is needed for the conversion.endothermic effect was detected at an extrapolated onset temperature of 724°C. The enthalpy of the main melting effect of 499 J/g is in the same range as the value of 480 J/g observed for pure NaCl, whereas the enthalpy of the first effect is only 6 J/g. These results demonstrate that the table salt is – as expected – not pure NaCl; the DSC curve found for the table salt sample is typically observed for binary salt mixtures [7]. In this case, NaI-NaCl with a concentration of NaI in the lower percentage range is the most likely candidate [7].
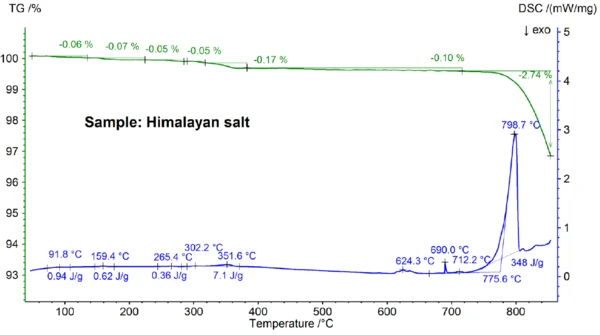
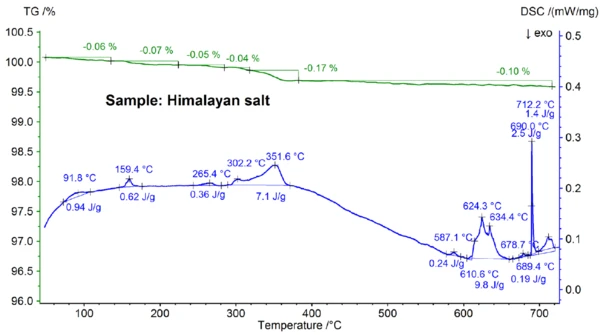
The STA results obtained for the Himalayan salt shown in figures 5a and 5b are even more complex than the results for the table salt. This can already be seen in the mass-loss steps of 0.06%, 0.07%, 0.05%, 0.05%, 0.17% and 0.10% observed below 700°C just for the Himalayan salt sample (see figure 5b). Below about 400°C, the DSC signal showed EndothermicA sample transition or a reaction is endothermic if heat is needed for the conversion.endothermic effects which correlate – and which are due to the mass-loss steps; details like peak temperatures and enthalpies can be seen in figure 5b. The mass loss below about 200°C is most probably due to the release of moisture and the dehydration of gypsum (mixture of CaSO4∙2H2O and CaSO4∙½H2O) with an estimated concentration in the sub percent range. Between about 200°C and 400°C, the mass-loss steps could be due to the Decomposition reactionA decomposition reaction is a thermally induced reaction of a chemical compound forming solid and/or gaseous products. decomposition of various carbonates while the mass-loss step in the range of 450°C could be due to the dehydration of Ca(OH)2. For further interpretations of the mass-loss steps, evolved gas analysis would clearly be helpful [8]. The DSC result at above about 580°C is also very complex (see figure 5b): At least seven EndothermicA sample transition or a reaction is endothermic if heat is needed for the conversion.endothermic DSC effects were detected. The main peak at 799°C is again most probably due to a binary, NaCl-rich mixture such as NaI-NaCl, KCl-NaCl [7] or Na2CO3- NaCl [7, 9], from where the DSC peak at 712°C may also originate. The remaining DSC effects between 580°C and 720°C are presumably due to the melting processes of several iodides, fluorides, chlorides, carbonates or sulfates and mixtures of them with NaCl or KCl [7, 10]. For example, the DSC peak at 587°C could be due to CaI2 or K2SO4, the sharp peak at 690°C might be due to KI and the peak at 679°C could be due to a structural transformation of Fe2O3 [10]. Further details like peak temperatures and enthalpies can again be seen in figure 5b. The mass loss of the Himalayan salt of 2.74% above 700°C (see figure 5a), which is again due to partial evaporation, is significantly higher than that of the other samples investigated.
Conclusion
Investigations of NaCl, KCl, table salt and Himalayan salt by means of the STA 449 F5 Jupiter® demonstrated that this instrument is well suited for studying substances such as alkali salts and mixtures of them. Particularly the DSC signal, which very clearly reflects melting processes and other phase transformations, allows for an investigation of phase diagrams via melting temperatures and even enthalpies. The TGA signal indicates not only evaporation of the sample but also mass-loss steps due to the Decomposition reactionA decomposition reaction is a thermally induced reaction of a chemical compound forming solid and/or gaseous products. decomposition of, for example, impurity substances which can be identified and quantified in several cases.