Introduction
Methods of thermal analysis are widely used in the field of polymers to characterize and identify materials. In this case study, PMMI was investigated by means of DSC, TGA and TGA-FT-IR. PMMI (Polymethacrylmethylimide) is a thermoplastic polymer. As it is an amorphous polymer, it features high transparency. Therefore, it can be used in specific applications such as the automotive industry for headlight modules, or more generically for optical components like light guides, lenses, fiber optics, luminaire covers, sight glasses and cover lenses.
Test Results
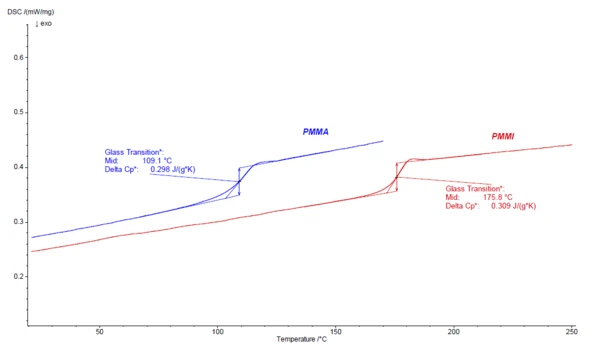
Compared to PMMA (Polymethylmethacrylate), PMMI has a higher heat deflection temperature, which is also reflected by the higher Glass Transition TemperatureThe glass transition is one of the most important properties of amorphous and semi-crystalline materials, e.g., inorganic glasses, amorphous metals, polymers, pharmaceuticals and food ingredients, etc., and describes the temperature region where the mechanical properties of the materials change from hard and brittle to more soft, deformable or rubbery.glass transition temperature (Tg) as compared to PMMA. Figure 1 shows the DSC results of the 2nd heating curves for PMMI in direct comparison to PMMA. For these two grades, the Tg of PMMA is at 109.1°C (midpoint) and of PMMI far higher at 175.8°C (midpoint).
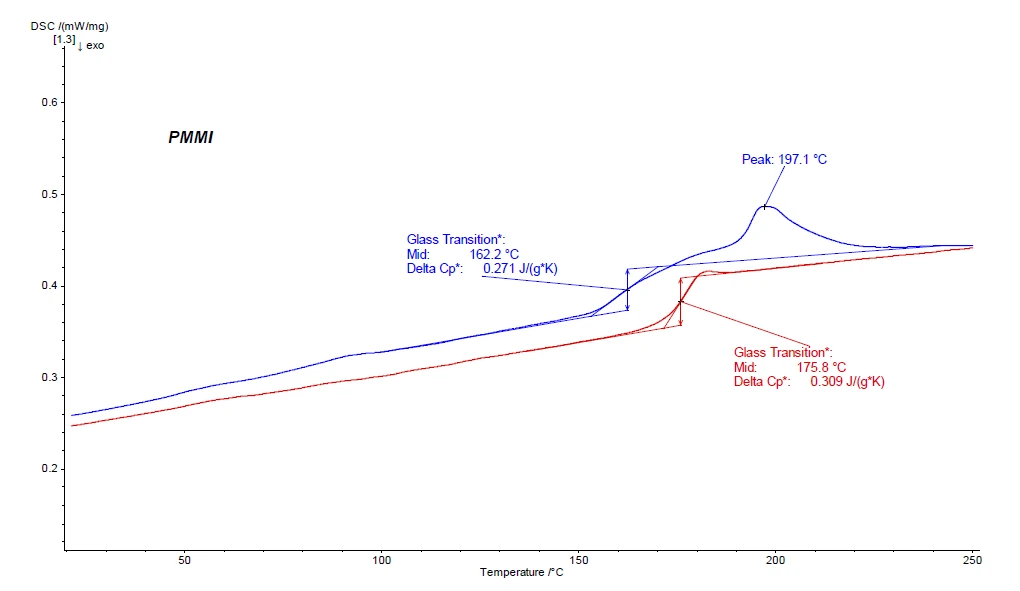
In the first heating curve of the DSC experiment (blue curve in figure 2), one can observe – besides the Glass Transition TemperatureThe glass transition is one of the most important properties of amorphous and semi-crystalline materials, e.g., inorganic glasses, amorphous metals, polymers, pharmaceuticals and food ingredients, etc., and describes the temperature region where the mechanical properties of the materials change from hard and brittle to more soft, deformable or rubbery.glass transition Tg at 162.2°C – also an EndothermicA sample transition or a reaction is endothermic if heat is needed for the conversion.endothermic effect at 197.1°C directly following the Tg. As this effect is not seen in the second heating, it can be assumed that it may be an evaporation effect of a volatile component. This can be proven in a first step just by reweighing the sample after the DSC experiment (in this case, one would find a mass loss of approx. 1%). The Glass Transition TemperatureThe glass transition is one of the most important properties of amorphous and semi-crystalline materials, e.g., inorganic glasses, amorphous metals, polymers, pharmaceuticals and food ingredients, etc., and describes the temperature region where the mechanical properties of the materials change from hard and brittle to more soft, deformable or rubbery.glass transition of the PMMI can be found in the second heating curve (red curve in figure 2) at 175.8°C (midpoint).
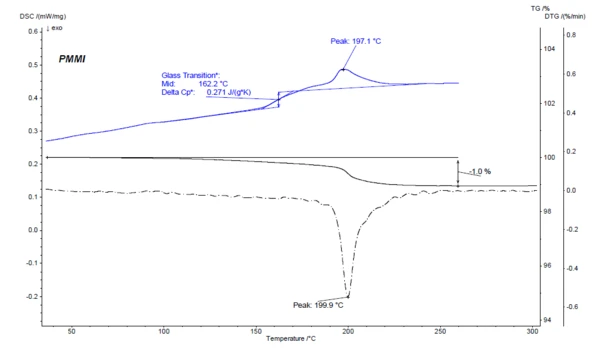
One thermoanalytical method for verifying the mass loss quantitatively is thermogravimetric analysis (TGA). The results for the PMMI sample are shown in figure 3. In the TGA curve, a mass-loss step of 1.0% is observed in the temperature range from RT to 260°C. The maximum of the mass-loss rate for this mass-loss step can be seen as a minimum in the DTG curve (first derivative of the TGA curve) at 199.9°C. This mass-loss step clearly corresponds to the EndothermicA sample transition or a reaction is endothermic if heat is needed for the conversion.endothermic effect that was observed at 197.1°C (peak temperature) in the first heating curve of the DSC measurement.
By means of TGA, one can quantify the mass loss at a certain temperature; it would now be of greater interest to learn what gas evolved during this mass-loss step, in order to gain deeper insight into the composition of the sample.
To detect and identify the evolved gas, the TGA system was coupled to an FT-IR spectrometer; this can be done in a unique way with the NETZSCH PERSEUS® TG 209 F1 Libra®. The PERSEUS® coupling system is a direct coupling of the TG 209 F1 Libra® with the Bruker Alpha FT-IR spectrometer.
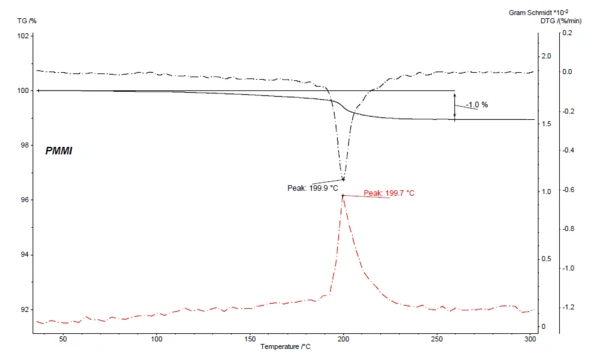
Figure 4 depicts, for the coupled TGA-FT-IR measurement on PMMI, the Gram-Schmidt curve (red) along with the TGA and DTG curves. The Gram-Schmidt curve displays the overall IR intensities and behaves as a mirror image of the mass-loss rate (DTG) while also showing maximum intensities during the mass-loss steps.
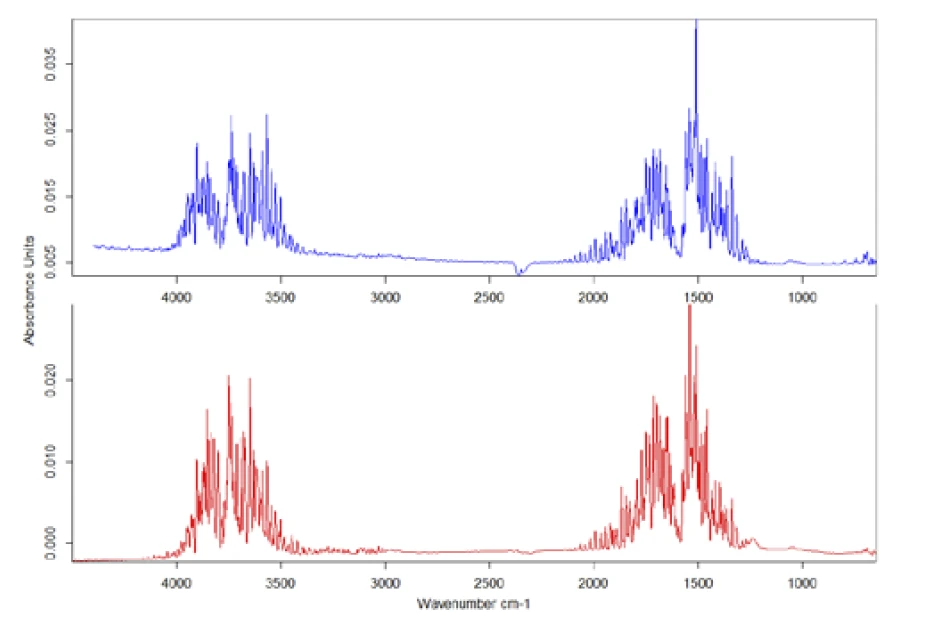
To evaluate the IR data in detail, the individual spectrum was taken at the mass-loss step at 200°C and compared to entries in the installed databases (figure 5). In this case, comparison with the library shows that the gas released is definitely H2O.
Conclusion
With this insight into the material, the DSC results for the first and second heating runs (figure 2) can also be explained more precisely. Due to the sample’s water content, the Glass Transition TemperatureThe glass transition is one of the most important properties of amorphous and semi-crystalline materials, e.g., inorganic glasses, amorphous metals, polymers, pharmaceuticals and food ingredients, etc., and describes the temperature region where the mechanical properties of the materials change from hard and brittle to more soft, deformable or rubbery.glass transition temperature seen in the first heating is lower than the one seen in the second heating. Moisture in a polymer acts like a plasticizer and significantly reduces the Glass Transition TemperatureThe glass transition is one of the most important properties of amorphous and semi-crystalline materials, e.g., inorganic glasses, amorphous metals, polymers, pharmaceuticals and food ingredients, etc., and describes the temperature region where the mechanical properties of the materials change from hard and brittle to more soft, deformable or rubbery.glass transition temperature.