Introduction
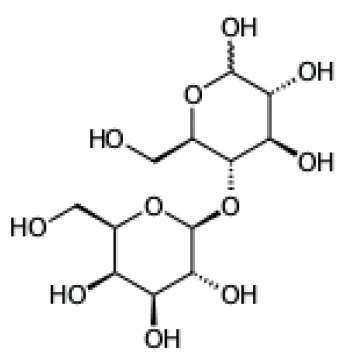
Lactose is a disaccharide sugar composed of galactose and glucose that is found in the milk of mammalians. Lactose makes up around 2% to 8% of milk (by weight), although the amount varies among species and individuals. The name comes from lac (gen. lactis), the Latin word for milk plus the -ose ending used to name sugars [2].
Lactose can be obtained in an amorphous or a crystalline form. In milk, both the α- and ß- crystalline forms are found. They differ from each other in the orientation of a hydroxyl group of the carbon ring. α-lactose crystallizes as a monohydrate while ß-lactose does not contain crystal water, so it is often described as anhydrous lactose. Amorphous lactose is obtained when a highly concentrated lactose solution is dried quickly [3]. All these forms of lactose are used as excipients in pharmaceutical products. However, each of them has physical properties that differ greatly from the other two; they are thus each used for different purposes [3].
Measurement Conditions
The measurements were carried out with the TG 209 F1 Libra® under a nitrogen atmosphere. A lactose sample (initial mass: 6.43 mg) was placed in an aluminum oxide crucible and heated from room temperature to 600°C at 10 K/min. The gases evolved during heating were directly transferred into the gas cell of the FT-IR spectrometer by Bruker Optics.
Measurement Results
Figure 2 depicts the mass-loss curve as well as its first derivative (DTG). The Gram-Schmidt curve indicates the amount of the evolved substances detected by the FT-IR during heating.
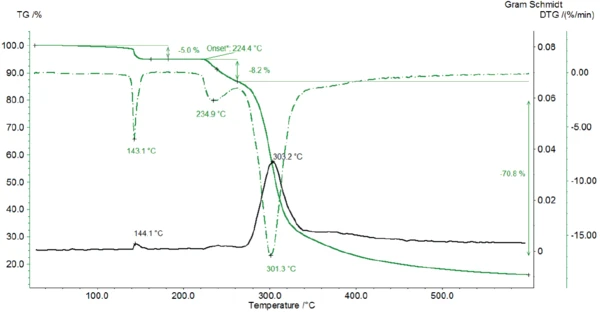
In a first mass-loss step with a DTG peak at 143°C, the sample loses 5% of its initial mass. Lactose has a molecular mass of 342.3 g/mol [2]. In lactose monohydrate, each lactose molecule is associated with one molecule of water, yielding a molecular mass of 360.3 g/mol. That corresponds to a mass loss of 5% as soon as the crystal water is completely released.
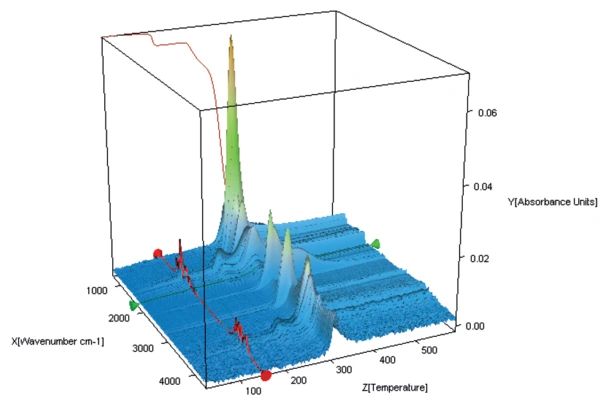
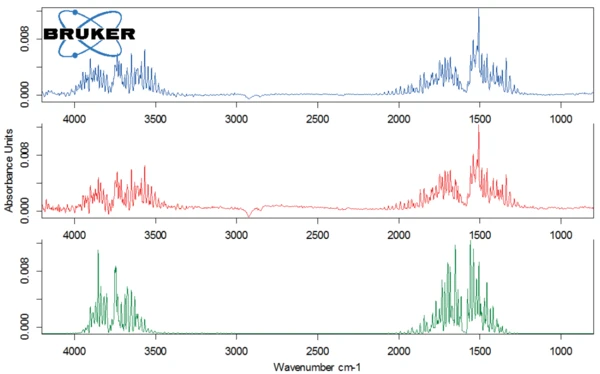
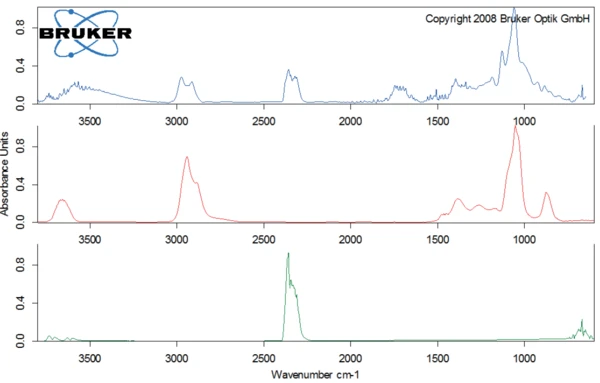
Figure 3 shows the 3-dimensional spectrum of the products released during heating. The spectrum of the products released at 147°C (figure 4, top spectrum) proves that only water evaporates at this temperature: It is the crystal water contained in the sample. This, together with the mass loss of 5% discussed above, confirms that the lactose sample being studied is a monohydrate.
The degradation of lactose monohydrate begins at 224°C (onset temperature of the TGA curve). The process runs in two steps, as can be seen with the two peaks in the DTG curve. The first mass-loss step of 8% is associated with a new release of water (figure 4, spectrum in the middle) resulting from Decomposition reactionA decomposition reaction is a thermally induced reaction of a chemical compound forming solid and/or gaseous products. decomposition.
The second degradation step occurs at 301°C (peak of the DTG curve) with a mass loss of 71%. Figure 5 depicts the spectrum of the substances detected by the FT-IR detector at 309°C (top). The comparison with the library spectra shows that lactose decomposes; the structure ring of lactose is broken and carbon dioxide and probaly ethanediol are released.
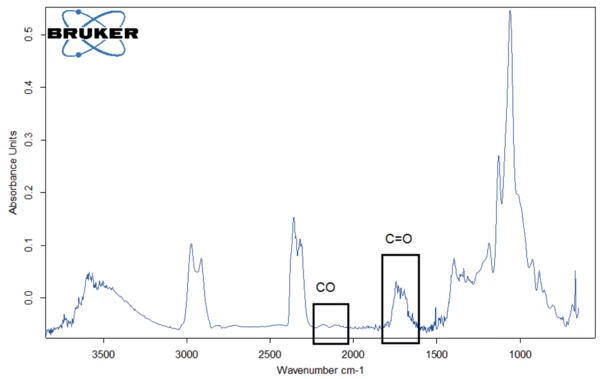
For better detection of the other substances released, the FT-IR library spectrum of water was subtracted from the FT-IR spectrum measured at 309°C (figure 6). This allowed for carbon monoxide as well as C=O bonds to be identified in the evolved gases.
Conclusion
A single measurement with the TGA-FT-IR was enough to obtain a variety of information about the lactose sample. Firstly, it was possible to confirm that it is a monohydrate. Secondly, it was possible to determine the temperature of Decomposition reactionA decomposition reaction is a thermally induced reaction of a chemical compound forming solid and/or gaseous products. decomposition. Finally, it was possible to identify the substances released during degradation as water, carbon dioxide, carbon monoxide, ethane-diol and a product containing a C=O bond.
TGA-FT-IR can be seen as a complex measurement method because it combines two different powerful techniques, providing a wide range of results. However, despite its complexity, the coupling of a thermobalance to an FT-IR spectrometer allows for very easy sample preparation and measurement, combining user-friendliness with high performance.