Introduction
Pressure-sensitive adhesives (PSAs) are complex colloidal systems. They are made of two main components, a tackifier part which makes the adhesive sticky, and a latex part which helps the tackifier to flow. Many additives can be used to change the wet properties of the adhesive, how stable it is under storage and how it mixes and coats the substrate surface.
During the compounding of PSAs, many component parts are mixed together. The tackifier emulsion and the aqueous latex are mixed with other components to produce the adhesive ready for coating. Each component should be rheologically characterized to determine its pump ability. The whole PSA should also be characterized to help determine pumping and filtering properties.
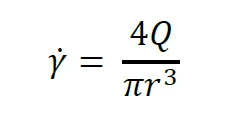
To estimate the shear rate, encountered during processing, the following equation can be used, where Q is the volumetric flow rate and r the pipe radius.

Measuring the viscosity at selected shear rates slightly above and below the calculated value allows a relevant portion of the flow curve to be generated. A Power Law ModelThe power law model is a common rheological model to quantify (typically) the shear thinning nature of a sample, with the value closer to zero indicating a more shear thinning material.power law model can then be fitted to the data and values of k and n are determined to describe its flow behavior. The Power Law ModelThe power law model is a common rheological model to quantify (typically) the shear thinning nature of a sample, with the value closer to zero indicating a more shear thinning material.Power Law Model is written as

k is the consistency
n is the power law index
η is the viscosity
σ is the shear stress
·γ is the shear rate
Consistency has the units of Pas but is numerically equal to the viscosity measured at 1 s-1. The power law index ranges from 0 for very shear thinning materials to 1 for Newtonian materials.
Experimental
- Three pressure-sensitive adhesives were measured and compared in this study.
- Rotational rheometer measurements were made using a Kinexus rotational rheometer with a Peltier plate cartridge and a 40 mm/1° cone-plate measuring system, using standard pre-configured sequences in the rSpace software.
- A standard loading sequence was used to ensure that both samples were subject to a consistent and controllable loading protocol.
- All rheology measurements were performed at 25°C.
- The relevant shear rate for flow in the pipe was automatically calculated as part of the test sequence using inputted values of pipe radius, length and volumetric flow rate.
- A shear rate table using a start value of (calculated shear rate / 2) and an end value of (calculated shear rate x 2) was performed, and a Power Law ModelThe power law model is a common rheological model to quantify (typically) the shear thinning nature of a sample, with the value closer to zero indicating a more shear thinning material.power law model fitted to the resultant flow curve.
Results and Discussion
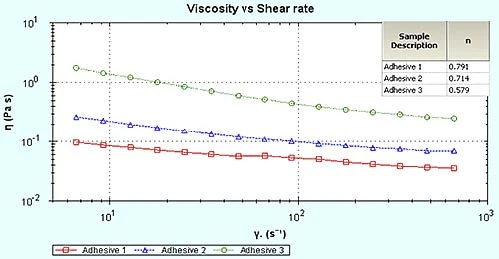
From Figure 1, Adhesive 3 has the highest viscosity and will therefore be the most difficult to pump and mix, followed by Adhesive 2 and then Adhesive 1. Adhesive 3 shows a lower value for η than the other two samples, and will become easier to pump at higher shear rates. Increasing the pumping shear rate can help minimize pumping problems by decreasing the sample’s viscosity. This is most effective when the shear thinning index (η) is small (<<1). A high viscosity sample, such as 3 will be more difficult to pump than a low viscosity sample unless it has a very small shear thinning index.

Conclusion
Formulations can be analyzed and their pump ability and mix ability can be assessed prior to plant trials. Similar formulations can be tested to determine the best combination of additives in order to optimize the sample for pumping and mixing.