Introduction
While most suspensions and polymer structured materials are shear thinning, some materials can also show shear thickening behavior where viscosity increases with increasing shear rate or shear stress. This phenomenon is also often referred to as dilatancy, and although this refers to a specific mechanism for shear thickening, the terms are often used interchangeably. In most cases, shear thickening occurs over a decade of shear rates and there can be a region of shear thinning at lower and higher shear rates.
Usually, dispersions or particulate suspensions with high concentration of solid particles, pastes, associative polymers such as HASE, HEUR polymers, etc., exhibit shear thickening. Materials exhibiting shear thickening are much less common in industrial applications than materials exhibiting shear thinning, however, where encountered shear thickening, materials can lead to severe processing problems. Materials which undergo microstructural or orientation changes on application of shear, that lead to increased resistance to flow, will tend to show shear thickening.
For suspensions, this generally occurs in materials that show shear thinning at lower shear rates and shear stresses. At a critical shear stress or shear rate, the organized flow regime responsible for shear thinning, is disrupted and so called ‘hydro-cluster’ formation or ‘jamming’ can occur. This gives a transient solidlike response and an increase in the observed viscosity. Shear thickening can also occur in polymers, in particular amphiphilic polymers, which at high shear rates may open-up and stretch, exposing parts of the chain capable of forming transient intermolecular associations.
Mathematically, the shear thickening behavior can be modeled using the powerlaw model:
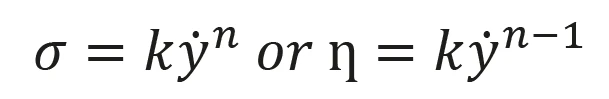
Where
k is the consistenc
n is the power law index
σ is the shear rate,
·γ is the shear rate.
With n greater than 1 for shear thickening fluids.
It should be noted that an upturn in viscosity at high shear rates can occur through other phenomenon such as fluid turbulence. This effect, however, tends to occur with lower viscosity fluids and can be predicted from Reynolds number calculations
Experimental
- The shear thickening behavior of a 75% w/w corn starch/water suspension mixture was evaluated by performing a table of shear rate test and analyzing the resultant curve by fitting a Power Law ModelThe power law model is a common rheological model to quantify (typically) the shear thinning nature of a sample, with the value closer to zero indicating a more shear thinning material.power law model.
- Rotational rheometer measurements were made using the Kinexus rotational rheometer with a Peltier plate cartridge and a roughened parallel plate measuring system, and using standard pre-configured sequences in the rSpace software.
- A standard loading sequence was used to ensure that both samples were subject to a consistent and controllable loading protocol.
- All rheology measurements were performed at 25°C.
- The flow curve was generated using an equilibrium table of shear rates test between 0.1 and 100 s-1 and a Power Law ModelThe power law model is a common rheological model to quantify (typically) the shear thinning nature of a sample, with the value closer to zero indicating a more shear thinning material.power law model fitted to a manually selected portion of this curve.
Results and Discussion
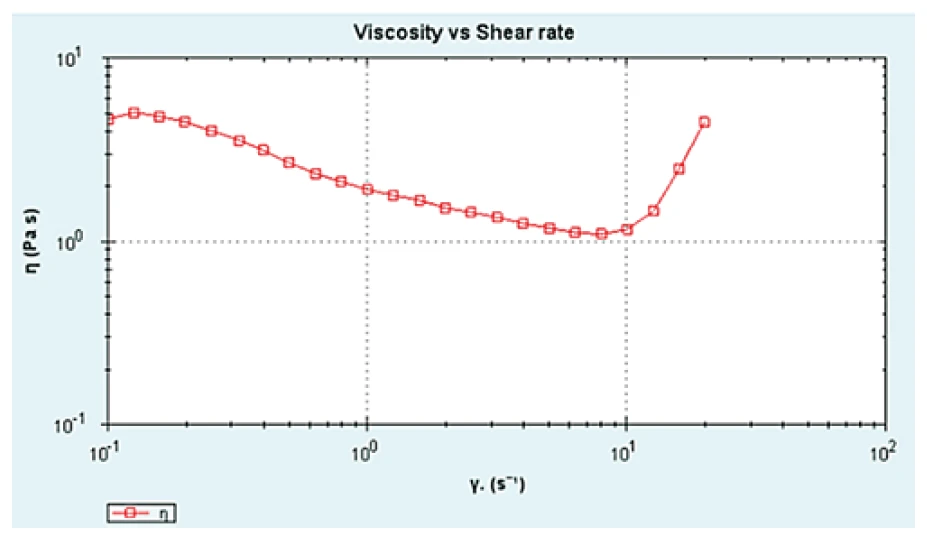
Figure 1 shows the viscosity-shear rate profile for the Corn Starch dispersion. At low shear rates, the sample exhibits shear thinning behavior; however, at a critical shear rate of approximately 8 s-1, a sharp upturn in viscosity, characteristic of shear thickening behavior, is observed. Fitting a Power Law ModelThe power law model is a common rheological model to quantify (typically) the shear thinning nature of a sample, with the value closer to zero indicating a more shear thinning material.power law model to the data between 0.15 s-1 and 6.5 s-1, the reported value for the power law index (n) is 0.57, thus confirming shear thinning behavior (n<1). Fitting the same model to the data between 10 s-1 and 20 s-1, the value of n is 3.01, which indicates significant shear thickening (n>1).s.
Conclusion
The corn starch-water mixture tested exhibited strong shear-thickening behaviour above 8 s-1 as confirmed by the power law index (n) which gave a value of 3 for data between 10 and 20 s-1.
Please note...
that a cone-plate geometry or a cylindrical geometry can also be used. A sand blasted geometry should be considered if the material is likely to show wall slip effects. Larger geometries are useful for measurements at low torques, which are more likely to be encountered at lower shear rates and stresses. The use of a solvent trap is also recommended for these tests since evaporation of solvent (e.g., water) around the edges of the measuring system