Introduction
In the graphite industry, high-purity graphite generally refers to graphite containing more than 99.99% carbon. At present, the application of high-purity graphite in the photovoltaic industry is relatively large. Graphite is also the most commonly used anode material in lithium-ion battery manufacturing due to its relatively low cost, high energy DensityThe mass density is defined as the ratio between mass and volume. density, and high conductivity. Graphite’s hexagonal layered structure allows lithium to intercalate. It ensures that the battery remains stable during charge and discharge cycles. Its structural stability results in longer battery life. For high-performance batteries, a purity higher than 99.95% and a particle size between 10 and 30 μm is required.

Measurement Conditions
The STA Jupiter® series coupled to the NETZSCH Aëolos® mass spectrometer is well suited for determination of even the tiniest impurities. High sample loads can be achieved even with low-DensityThe mass density is defined as the ratio between mass and volume. density powders using the available STA crucibles for possible large sample volumes (up to 10 ml). This, combined with the high-end MS coupling system (transfer temperatures up to 300°C), allows for the transfer and identification of low levels of even highboiling materials.
In table 1, the measurement conditions are summarized.
Table 1: Measurement parameters for TGA-MS
| Furnace | SiC |
| Sample carrier | TGA pin with OTS® (Oxygen Trap System) |
| Crucible | Al2O3, 5 ml, open |
| Sample thermocouple | Type S |
| Purge gas | Ar, 50 ml/min |
| Protective gas | Ar, 20 ml/min |
| Temperature program | RT - 800°C, 10 K/min |
| MS parameter | Scan mode in the range 1-300 amu, Integration time per amu 20 ms |
| Sample mass | 3226.33 mg |
Measurement Results and Discussion
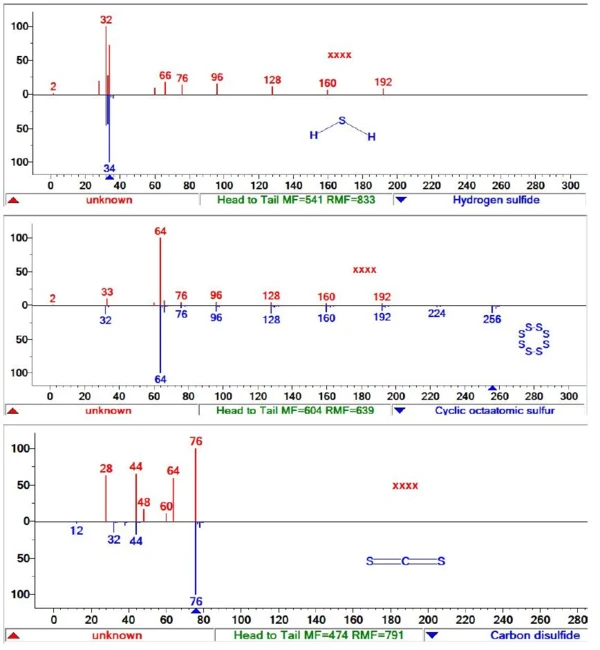
The graphite sample was heated in an inert atmosphere to 800°C, during which it exhibited two mass-loss steps of 0.14% and 0.026% with DTG peaks at 307°C and 562°C. The mass spectrometer detected the release of water (m/z 18), carbon dioxide (m/z 44) and sulfur (S8= m/z 64). The release of m/z 32 and m/z 34 can be associated with the release ofH2Sat 324°C. Mass number 76 indicates the release ofCS2 at 334°C, 398°C and 560°C. The release of sulfur was detected with an MS peak at 324°C.
Figure 2 shows the mass-loss curves in green with the corresponding traces of mass numbers m/z 18, 32, 44, 64 und 76.

Comparison of the spectra measured at different temperatures with the NIST library proves the release of the various compounds; see figure 3.
Summary
In conclusion, STA-MS coupling with measurements in TGA mode is a suitable method for detecting and identifying impurities in ultra-high-purity graphite samples. It was possible to Identify the simultaneous release of different sulfur compounds and to relate these to the mass-loss curve. With the help of this highly sensitive analytical method, the purity of different graphite grades can be studied and controlled, especially in applications such as batteries, where high purity is mandatory.