Introduction
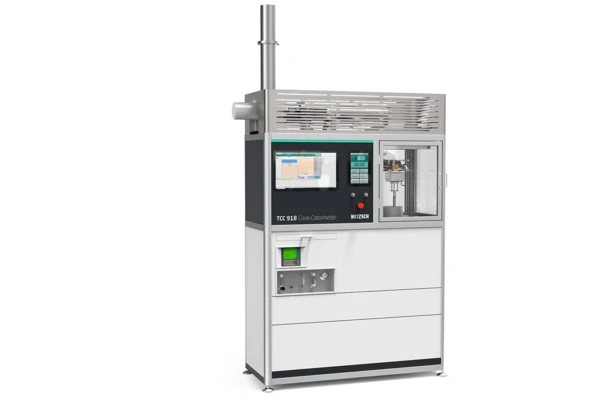
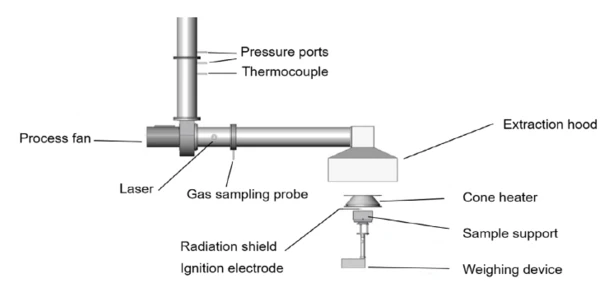
Analyzing the fire behavior of materials is a key part of safety engineering. The TCC 918 Cone Calorimeter (figure 1) is a well-established testing device used to determine key parameters such as the heat-release rate (HRR), mass loss and smoke emissions. The chemical composition of a material, as well as physical parameters such as sample geometry and fire behavior, can influence the measurement results.
In accordance with ISO 5660-1, the standard dimensions for test specimens are 100 mm × 100 mm, with a thickness between 6 mm and 50 mm. This investigation aims to analyze the influence of sample thickness on the measurement results.
Test Setup and Conditions
Nine PMMA samples with thicknesses of 7 mm, 14 mm and approximately 19 mm (three measurements per thickness) were investigated.
The samples were placed on a horizontal sample holder, which was mounted on a weighing cell to enable continuous recording of the mass loss. Heat was applied using an electric cone heater with a constant heat flux DensityThe mass density is defined as the ratio between mass and volume. density of 50 kW/m². Ignition occurred via spark igniters once sufficient PyrolysisPyrolysis is the thermal decomposition of organic compounds in an inert atmosphere.pyrolysis gases had been released. The resulting flue gases were analyzed to determine the massflow rate, flue gas temperature and the concentrations of O₂, CO₂ and CO. Smoke DensityThe mass density is defined as the ratio between mass and volume. density was determined by light transmission. The gas analysis system (Siemens Oxymat/ Ultramat) was calibrated prior to the measurement series, and the C factor¹ was validated using a methane burner. The measurement conditions are summarized in table 1.
Table 1: Measurement conditions
| Sample holder | Horizontal |
| Samples and thicknesses | PMMA of approx. 7, 14, 19 mm |
| Heat flow | 50 kW/m2 |
| Nominal heat-flow rate | 24.0 l/s |
| Distance to the cone heater | 25 mm |
1The C factor, defined in ISO 5660-1, is a calibration constant used to determine the heat-release rate (HRR). It links the signal from the oxygen analyzer to the actual heat energy released.
Measurement Results
Time of Ignition (TOI) and Time of Combustion until Extintion (TOF)
As expected, the time of ignition (TOI) is the same for all samples and is 22 seconds. This suggests that ignition is primarily influenced by surface properties rather than material thickness.
In contrast, the time of combustion until complete extinction (Time of Flame-off, or TOF) clearly depends on the sample thickness. The 7-mm samples burned for an average of 597 seconds; the 14-mm samples for an average of 857 seconds; and the 19-mm samples for an average of 1108 seconds (see table 2). Notably, with a uniform increase in sample thickness, uniform time differences in TOF were also observed. This allows an almost linear relationship between TOF and sample thickness to be derived, enabling simple interpolation for further thicknesses.
Table 2: Average times of ignition and combustion until extinction
| Sample thicknesses | TOI | TOF |
|---|---|---|
| 7 mm | 22 s | 597 s |
| 14 mm | 22 s | 857 s |
| 19 mm | 22 s | 1108 s |
Heat Release (HRR, THR)
The key aspect of the analysis is the heat release rate (HRR), which is defined as the amount of heat released per unit of time.
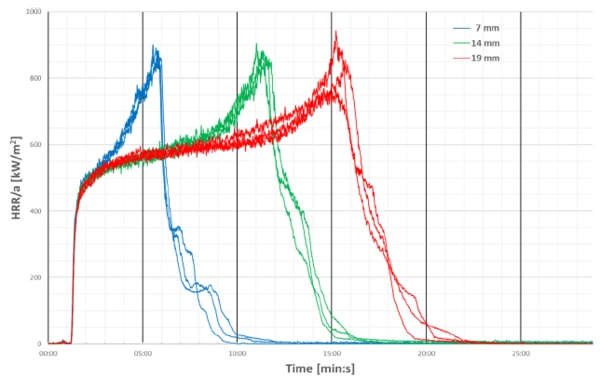
Figure 2 shows the HRR curves for PMMA samples of different thicknesses: 7 mm (blue), 14 mm (green) and 19 mm (red). Evaluating the HRR reveals clear differences between the sample thicknesses.
While the maximum HRR is comparable for all sample thicknesses (~880 kW/m²), the point at which it occurs shifts systematically to a later time as the sample thickness increases. This was expected, as thicker materials require more time to heat up completely and undergo PyrolysisPyrolysis is the thermal decomposition of organic compounds in an inert atmosphere.pyrolysis. In thinner samples, volatile components are released earlier.
The total heat released (THR) during combustion corresponds to the integral of HRR over time. Figure 3 shows the THR curves. As expected, the THR values increase with sample thickness.
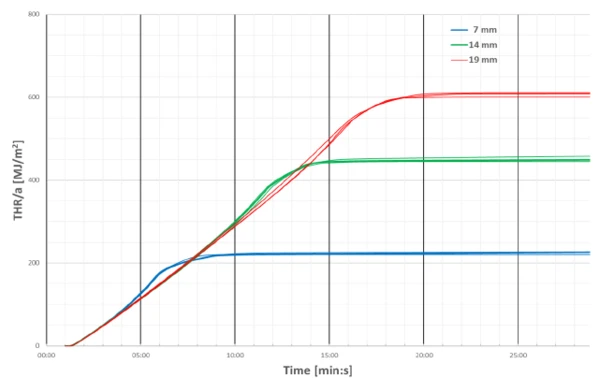
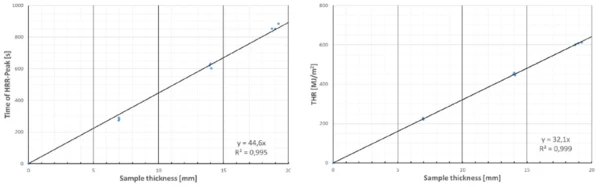
Figure 4 shows the linear relationship between sample thickness and a) the time of the HRR maximum and b) the total heat release. The correlation confirms that, with complete combustion, THR is essentially determined by the amount of material used. The linear relationship between sample thickness, time of combustion until complete extinction (TOF) and THR indicates that all samples were almost completely converted. Two individual measurements with different sample thicknesses can easily be converted to the corresponding values for other sample thicknesses.
Smoke Produktion (SPR, TSP)
Another important aspect of the investigation is recording smoke development. This is achieved by measuring the light transmission in the flue gas flow. A laser beam is guided through the exhaust pipe (see figure 5). Decreasing transmission indicates an increase in smoke DensityThe mass density is defined as the ratio between mass and volume. density.
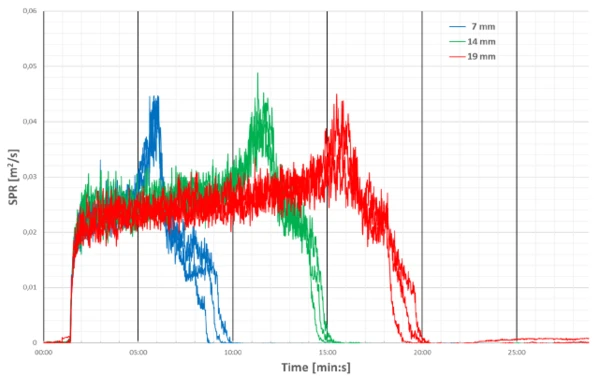
Similarly to the HRR, it was observed that it took a longer period of time to reach the maximum smoke production rate (SPR) as sample thickness increased. As can be seen in figure 6, the SPR curves show that thinner samples quickly release large amounts of smoke, while thicker samples release smoke over a longer period of time. This reflects the delayed PyrolysisPyrolysis is the thermal decomposition of organic compounds in an inert atmosphere.pyrolysis process, whereby thicker samples take longer to decompose completely.
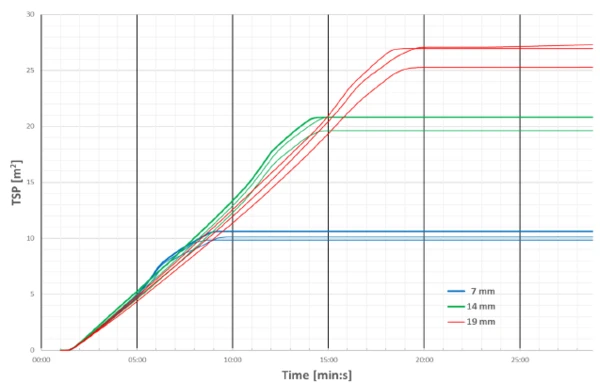
Total smoke production (TSP), shown in figure 7, increases with increasing sample thickness as expected.
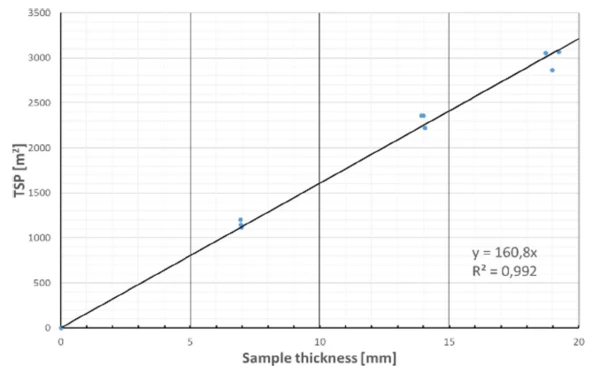
Figure 8 shows the almost linear relationship between sample thickness and TSP. This confirms that, once the sample mass has been fully converted, the total smoke output is essentially determined by the amount of material present.
Summary
Sample thickness considerably influences the fire parameters in the Cone Calorimeter. While the ignition time remains largely constant, the burning time, THR and TSP increase almost linearly with increasing sample thickness.
These results highlight the importance of always using identical sample thicknesses for comparative material tests to ensure reliable and comparable results. Thanks to the observed linearity, measurement results based on only two thicknesses can also be transferred to other thicknesses using simple interpolation or extrapolation.
Since materials of different thicknesses are often used for the same applications in practice, it is sensible to conduct tests under application-specific conditions, such as with typical component thicknesses or real installation situations, to achieve a realistic fire protection assessment. This is the only way to reliably assess actual fire behavior and make well-founded material selections.