The effect of temperature on the viscosity and viscoelasticity of polymers,and how these characteristics relate to their longer-timescale properties
Introduction
A polymer’s RelaxationWhen a constant strain is applied to a rubber compound, the force necessary to maintain that strain is not constant but decreases with time; this behavior is known as stress relaxation. The process responsible for stress relaxation can be physical or chemical, and under normal conditions, both will occur at the same time. relaxation time, shear viscosity and degradation time are all critical parameters for its processability, and are all three strongly affected by temperature. Increasing temperature reduces the shear viscosity and RelaxationWhen a constant strain is applied to a rubber compound, the force necessary to maintain that strain is not constant but decreases with time; this behavior is known as stress relaxation. The process responsible for stress relaxation can be physical or chemical, and under normal conditions, both will occur at the same time. relaxation time, and makes processing easier. However, it also initiates OxidationOxidation can describe different processes in the context of thermal analysis.oxidation and speeds up thermal degradation of the product. Furthermore, adding more heat requires more energy consumption.
Measurement Conditions
In this application note, the effect of the temperature on the shear viscosity of a polypropylene material is investigated by rotational rheometry. Table 1 summarizes the measurement conditions.
Table 1: Test conditions
| Device | Kinexus ultra+ with HTC Prime |
|---|---|
| Geometry | CP2/20 (Cone-Plate, cone angle: 2°, diameter: 20 mm) |
| Measurement gap | 70 μm |
| Temperatures | Between 190°C and 230°C |
| Atmosphere | Nitrogen, dynamic flow (1 l/min) |
Measurement Results
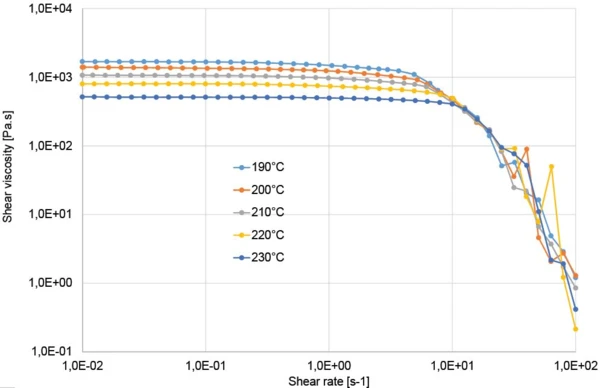
Figure 1 shows the shear viscosity curves of the material at different temperatures. For each temperature, the polymer has a Newtonian viscosity plateau in the low shear rate range. Here, the shear rate is not high enough to lead to a disentanglement of the polymer chains. An increase in temperature reduced the shear viscosity from 1,700 Pa.s at 190°C to 500 Pa.s at 230°C, thus a reduction by a factor of more than 3 for a temperature change of only 40°C!
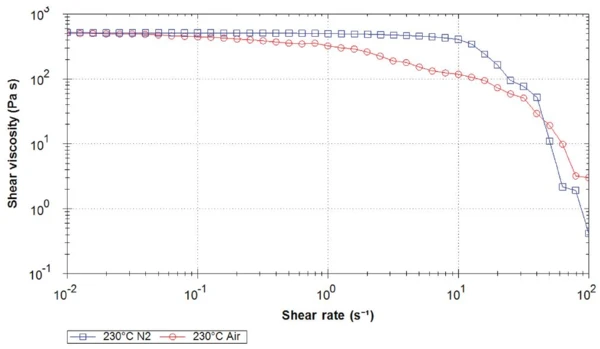
Special care should be paid not only to temperature, but also to the atmosphere. Figure 2 compares the shear viscosity curves obtained at 230°C in an inert atmosphere (nitrogen) and in an oxidizing atmosphere (air). The apparent decrease in shear viscosity almost from the very beginning of the test under air is due to the OxidationOxidation can describe different processes in the context of thermal analysis.oxidation of the polymer.
Normal Force Effects
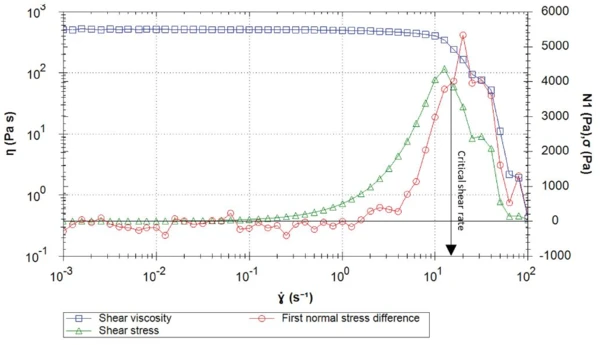
The shear viscosity curves in figure 1 (measured in nitrogen) would seem to indicate that the viscosity starts to decrease between 4 and 10 s-1 for all of the temperatures studied. However, a closer look at the data, specifically the shear StressStress is defined as a level of force applied on a sample with a well-defined cross section. (Stress = force/area). Samples having a circular or rectangular cross section can be compressed or stretched. Elastic materials like rubber can be stretched up to 5 to 10 times their original length.stress (σ) and first normal StressStress is defined as a level of force applied on a sample with a well-defined cross section. (Stress = force/area). Samples having a circular or rectangular cross section can be compressed or stretched. Elastic materials like rubber can be stretched up to 5 to 10 times their original length.stress difference (N1) shows that N1 exceeded σ, at shear rates above 12 s-1 (Figure 3 showing data at 230°C). When N1 exceeds σ, the data may not be reliable anymore.
This high normal force is due to the Weissenberg effect: At high shear rates, the polymer pushes up on the upper geometry (and down on the lower) because its extensional viscosity causes it to coil around the cone, so that the normal force increases steadily. Since the gap remains constant, the geometries cannot move vertically and when the normal force exceeds the rotational shear StressStress is defined as a level of force applied on a sample with a well-defined cross section. (Stress = force/area). Samples having a circular or rectangular cross section can be compressed or stretched. Elastic materials like rubber can be stretched up to 5 to 10 times their original length.stress, the sample starts to be ejected from the gap. After this, we start to see a decrease in N1.
Oscillatory Measurement of Polymers
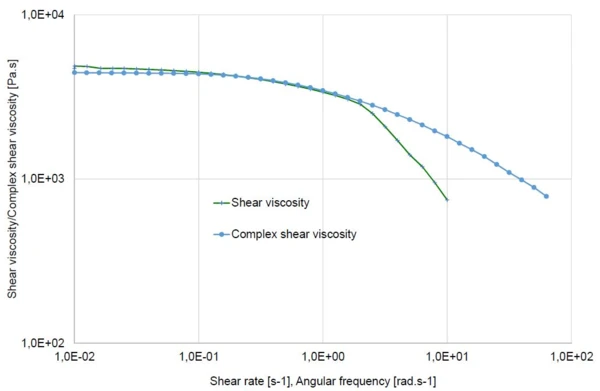
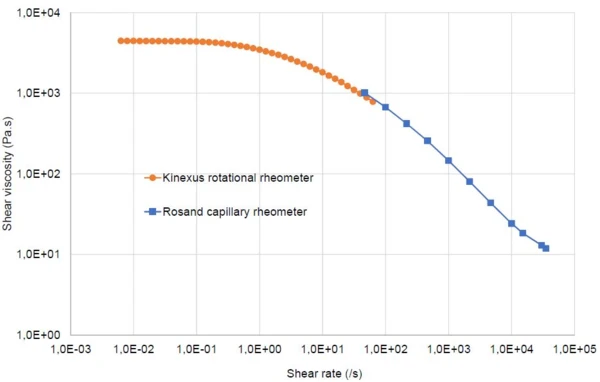
As steady shear measurements of polymer melts between cones and parallel plates often cause edge fracture of the sample, viscosity tests of these materials are typically performed using an oscillation measurement. The Cox-Merz rule [1] is an empirical relationship that holds for most unfilled polymer samples and states that the steady shear viscosity at a known shear rate will be equal to the shear viscosity (complex component) at the equivalent angular frequency (see figure 4). Therefore, oscillation tests often used for polymer melt viscometry testing. Another method of measuring the shear viscosity at higher shear rates is using the Rosand capillary rheometer (see figure 5).
Functional Principle of a Rotational Rheometer (Oscillation Measurement)
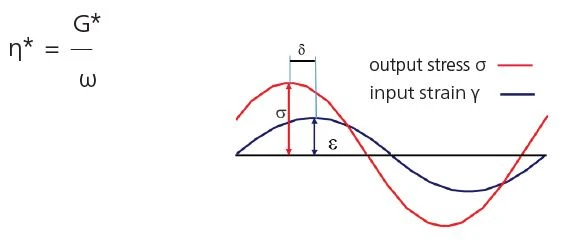
The upper plate oscillates with a defined frequency f [Hz] or ω [rad/s] and amplitude [%] or complex shear StrainStrain describes a deformation of a material, which is loaded mechanically by an external force or stress. Rubber compounds show creep properties, if a static load is applied.strain γ [%].
The complex shear StressStress is defined as a level of force applied on a sample with a well-defined cross section. (Stress = force/area). Samples having a circular or rectangular cross section can be compressed or stretched. Elastic materials like rubber can be stretched up to 5 to 10 times their original length.stress σ* [Pa] required for this oscillation is determined and split into an "in-phase" and an "out-of-phase" part.
The "in-phase" part is related to the elastic properties (→ G`, storage shear modulus), the "out-phase" part to the viscous properties (→ G", loss shear modulus) of the viscoelastic material.
Result: The viscoelastic properties of the sample are determined, in particular its complex stiffness G* and its complex shear viscosity η* [Pa·s]:
From Different Temperatures to Different Frequencies: Time-Temperature Superposition (TTS)
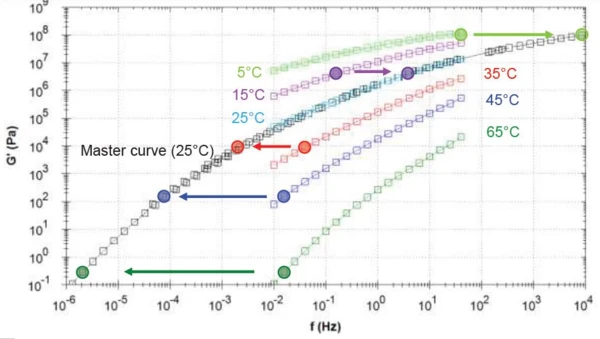
The temperature of a polymer doesn't only affect the shear viscosity (as previously discussed), but also its viscoelastic properties. In fact, as a polymer’s disentanglement and re-entanglement rate is related to the molecular Brownian motion, changing temperature affects the viscoelastic properties in the same way as a change in time. The behavior of a polymer during a defined time at a defined temperature is similar to the one at a shorter timescale (i.e., higher frequency) and a higher temperature. This characteristic can be used to construct a “master curve”, i.e., typical resulting curves of an oscillation tests over a very broad frequency range. The master curve is created by combining normal range frequency sweep results from different temperatures (isotherms). As an example of this, figure 6 shows the master curve on an asphalt binder at 25°C (black curve) calculated using frequency sweeps at different temperatures between 5°C and 65°C (more information about this here). This way, the master curve predicts long-time behavior of the material (i.e., in the low frequency range) without the need of time-consuming measurements. Here, the testing of the point at the lowest displayed frequency (10-6 Hz) would correspond to a time of more than 11 days!
Conclusion
The Kinexus rotational rheometer was capable of accurately characterizing the temperature dependence of the shear viscosity of polypropylene. Steady shear viscosity results were acceptable for the lower shear rates, however at moderate to high shears, the first normal StressStress is defined as a level of force applied on a sample with a well-defined cross section. (Stress = force/area). Samples having a circular or rectangular cross section can be compressed or stretched. Elastic materials like rubber can be stretched up to 5 to 10 times their original length.stress difference N1 exceeded the shear StressStress is defined as a level of force applied on a sample with a well-defined cross section. (Stress = force/area). Samples having a circular or rectangular cross section can be compressed or stretched. Elastic materials like rubber can be stretched up to 5 to 10 times their original length.stress causing edge failure. However, the Cox-Merz rule enables us to generate the same steady shear viscosity values using an oscillation test at higher frequencies. Therefore, oscillation frequency sweep tests may be used in place of viscometry tests to create flow curves. The temperature also influences the viscoelastic properties of polymers such that with the time-temperature-superposition principle, rheological behavior can be predicted over a very broad frequency range using much shorter tests.