Introduction
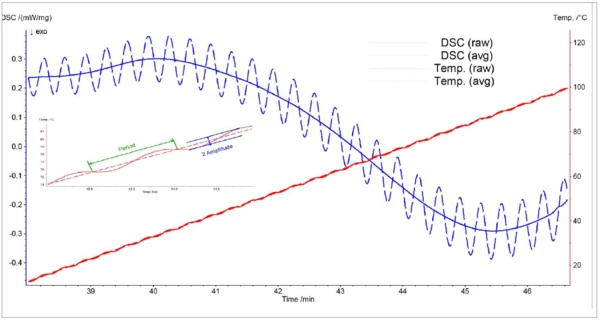
Temperature modulation is a method in which the linear temperature ramp is superimposed with a sinusoidal temperature signal, as depicted in figure 1:
T(t) = T0 + ßt + A · sin(ωt)
T0 initial temperature
β underlying heating rate
A amplitude of temperature oscillations
ω radial frequency
As a result, the DSC signal is also sinusoidal:
DSC(t) = DSC0 + ADSC · sin (ωt + φ)
DSC0 underlying DSC signal
ADSC amplitude of DSC oscillations
φ phase shift between temperature and DSC
Such a measurement allows for the separation of effects that oscillate with the temperature (reversing signal), such as a Température de Transition VitreuseThe glass transition is one of the most important properties of amorphous and semi-crystalline materials, e.g., inorganic glasses, amorphous metals, polymers, pharmaceuticals and food ingredients, etc., and describes the temperature region where the mechanical properties of the materials change from hard and brittle to more soft, deformable or rubbery.glass transition, from time-dependent processes (nonreversing signal), such as curing or evaporation.
The three parameters of heating rate, amplitude and frequency (or period) are set by the user. For mathematical separation of the reversing and non-reversing signals, the heating rate and frequency have to be chosen such that the effects to be separated contain at least 5 oscillations. This means, the period has to go down if the heating rate is increased.
But there are some limitations from the physical point of view, e.g., Thermal inertiaThe thermal inertia is equivalent to the PHI-factor. Both describe the ratio of mass and specific heat capacity of a sample or sample mixture compared to that of the vessel or sample container.thermal inertia of the instrument furnace or the Conductivité ThermiqueThermal conductivity (λ with the unit W/(m•K)) describes the transport of energy – in the form of heat – through a body of mass as the result of a temperature gradient (see fig. 1). According to the second law of thermodynamics, heat always flows in the direction of the lower temperature.thermal conductivity of the samples which is quite small for polymers. As heat-flux DSCs always had difficulties following fast oscillations, heating rates for temperature-modulated measurements were limited to a few K/min ... that is, until the launch of the DSC 214 Polyma.
One of the instrument’s distinguishing features is Arena®, a furnace with a low thermal mass allowing for temperature-modulated measurements at a heating rate of 10 K/min – i.e., as fast as a conventional DSC measurement.
Test Conditions
The curing of a two-component epoxy resin was measured with the DSC 214 Polyma. The polymer was heated four times at 10 K/min: first to 100°C, the second time to 120°C, then to 140°C, and finally to 160°C. Oscillations with a period of 20 s and an amplitude of 0.5 K were used as the modulation parameters. Between the heating runs, the sample was cooled to 0°C as quickly as possible.
Test Results
The results of the 1st heating are given in figure 2. The red line represents the total heat flow; i.e., the signal that would be detected during a conventional (not modulated) DSC measurement. An endothermic effect beginning at 21°C (onset temperature) cannot be correctly assessed because it is partly superimposed upon by the exothermic curing peak.
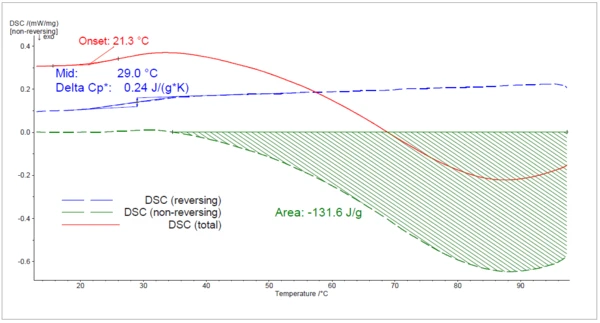
Correct evaluation of both effects is only possible by separating the signal into the reversing and non-reversing parts. As expected, the Température de Transition VitreuseThe glass transition is one of the most important properties of amorphous and semi-crystalline materials, e.g., inorganic glasses, amorphous metals, polymers, pharmaceuticals and food ingredients, etc., and describes the temperature region where the mechanical properties of the materials change from hard and brittle to more soft, deformable or rubbery.glass transition occurs in the reversing heat flow (at 29°C) whereas the curing peak is detected in the non-reversing curve. At the end of this 1st heating, curing had not finished, as the non-reversing heat flow had not gotten back to the baseline.
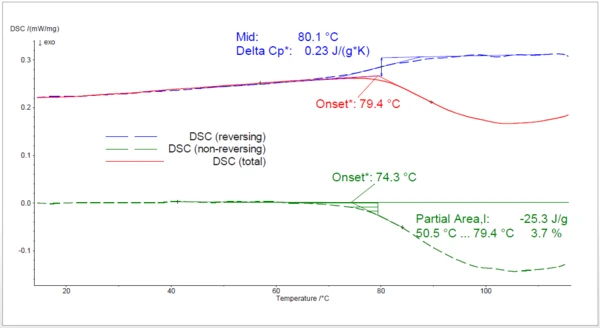
The results of the 2nd heating to 120°C after rapid cooling are displayed in figure 3. Here, the importance of a modulated measurement is even greater than for the 1st heating: an exothermic peak beginning at 79°C (onset temperature) was all that could be found in the total heat-flow signal. However, analysis of the reversing and non-reversing heatflows clearly shows that this effect is actually the sum of a glass transition at 80°C and a curing reaction beginning clearly at 74°C, 5°C sooner than in the evaluation of the total heat flow signal. The partial area integration between the beginning of the peak and 79°C delivers a value of 4%, which would have been missing with an non-modulated measurement.
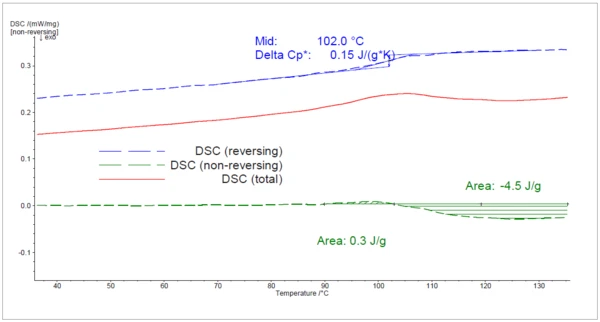
During the 3rd heating to 140°C (figure 4), the epoxy resin cured further, as can be seen in the exothermic peak detected in the non-reversing heat flow. The endothermic peak found is due to RelaxationWhen a constant strain is applied to a rubber compound, the force necessary to maintain that strain is not constant but decreases with time; this behavior is known as stress relaxation. The process responsible for stress relaxation can be physical or chemical, and under normal conditions, both will occur at the same time. relaxation of mechanical ContrainteLa Contrainte est définie par un niveau de force appliquée sur un échantillon d’une section bien définie. (Contrainte = force/surface). Les échantillons qui possèdent une section rectangulaire ou circulaire peuvent être comprimés ou étirés. Les matériaux élastiques comme les élastomères peuvent être étirés jusqu’à 5 à 10 fois leur longueur initiale.stress in the sample as a result of the fast cooling. The glass transition was determined at 102°C.
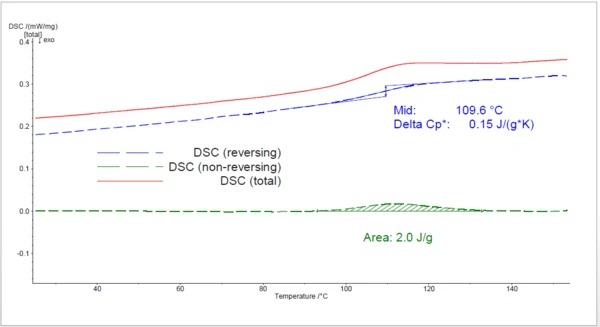
The 4th heating (figure 5) to 160°C shows the properties of the completely cured resin: a curing peak is no longer detected. The glass transition found at 110°C is overlapped with a RelaxationWhen a constant strain is applied to a rubber compound, the force necessary to maintain that strain is not constant but decreases with time; this behavior is known as stress relaxation. The process responsible for stress relaxation can be physical or chemical, and under normal conditions, both will occur at the same time. relaxation peak.
Conclusion
The curing behavior in a DSC is sometimes difficult to determine because of overlapping effects such as RelaxationWhen a constant strain is applied to a rubber compound, the force necessary to maintain that strain is not constant but decreases with time; this behavior is known as stress relaxation. The process responsible for stress relaxation can be physical or chemical, and under normal conditions, both will occur at the same time. relaxation, glass transition, curing, etc.
In order to gain a detailed insight into the curing behavior, it becomes necessary to separate the superimposed effects. This can be done by means of temperature-modulated DSC. Up until now, the TM-DSC method was very time-consuming, but with the DSC 214 Polyma, TM-DSC measurements as fast as standard DSC tests can be achieved.