Introduction
Plastics are part of our daily life in various ways. While technical parts are typically used for many years, the vast majority of packaging items are only used for days or weeks. At the same time, packaging applications make up around 50% of the plastic production. Since plastics have a poor biodegradability but are a valuable resource even after their service life, focusing on recycling pathways is of utmost importance [1].
The majority of plastics used in packaging are polyolefins; namely PP and PE like HDPE, LDPE and LLDPE. Thus, a combination of these materials is found in our recycling streams. This poses a problem, because PE and PP are immiscible and incompatible both in molten and in solid state [2]. Nuclear Magnetic Resonance (NMR) and other fractionation methods (e.g., TREF, CRYSTAF, SSA) have been successfully used to differentiate the content of PP into its fractions, but these methods are expensive (time and investment) and require a high level of expertise. The most common identification tool, Fourier Transform Infrared (FT-IR), is easy to use and delivers fast results for the vast majority of plastics, but cannot differentiate between the HDPE, LDPE and LLDPE, for instance, due to their similarity.
Differential Scanning Calorimetry (DSC) has been proven to be suitable for the analysis of mixed plastic waste and recycled polyolefin blends [3-6]. It utilizes the thermal fingerprint of a material, which is, among other factors, determined by their backbone structure, molecular weight, side groups and branching. The significantly different melting temperatures of the materials can be used to identify the different components of a mixture, while their weight percentage is estimated based on the melting enthalpy. In many cases, the peak areas of PP and PEs found in such mixtures overlap, which requires that the peaks are being separated. For this purpose, a study on mixtures of HDPE-PP in various proportions was carried out using the PeakSeparation analysis in the Proteus® software.
In order to better define the analysis range of each overlapping peak, temperature-modulated DSC (TM-DSC) was used for refinement.
Experimental
Material
For this study, commercially available HDPE and PP were investigated in various proportions with a total mass of approximately 5 mg:
Table 1: HDPE content of the samples
Nomenclature: PE90 = 90 wt% HDPE → 10 wt% PP
| Sample | PP100 | PE10 | PE20 | PE30 | PE40 | PE50 | PE60 | PE70 | PE80 | PE90 | PE100 |
| PP [mg] | 5.059 | 4.575 | 4.065 | 3.517 | 4.043 | 2.577 | 2.032 | 1.439 | 1.408 | 0.503 | - |
| PE [mg] | - | 0.525 | 0.525 | 1.045 | 1.510 | 2.557 | 3.054 | 3.529 | 3.965 | 4.479 | 5.024 |
| total [mg] | 5.059 | 5.100 | 5.110 | 5.027 | 5.088 | 5.134 | 5.086 | 4.968 | 5.013 | 4.982 | 5.024 |
| wt% PE | 0 | 10.3 | 20.5 | 30.0 | 40.2 | 49.8 | 60.0 | 71.00 | 79.1 | 89.0 | 100 |
DSC
The experiments were carried out with a DSC 214 Polyma using Concavus® pans with sealed and pierced lids. Other DSC instruments like the DSC 300 Caliris® can be used as well. The time-temperature program including the gases used are listed in table 2.
The 1st cooling and heating segments were performed to erase thermal history of the polymer samples. The DSC signal during the 2nd dynamic heating step is used for compositional analysis. The TM-DSC measurement mode is employed to define the analysis range. The Peak Separation function and the Identify database are used for identification and quantification.
PeakSeparation
The NETZSCH PeakSeparation function presents the experimental data as the additive superposition of peaks and allows separation of overlapped peaks using various types of editable profiles:
- Gaussian
- Cauchy
- Pseudo-Voigt (additional mixture of Gaussian and Cauchy)
- Frazer-Suzuki (asymmetric Gaussian)
- modified Labplace (double-sided rounded)
By applying these basic mathematical profiles to the measured curves, it becomes possible to mathematically separate the overlapping peaks. The algorithm looks for the peak parameters, which gives the best minimal least square fit between simulated and experimental curve.
In this work, the overlaying melting peaks of HDPE and PP were separated with the help of the PeakSeparation function to determine and quantify their proportions in the total sample mass. Reasonable values of the melting enthalpies, which result from the areas between the DSC curve and its corresponding baseline, are obtained by the appropriate selection of the Melting Temperatures and EnthalpiesThe enthalpy of fusion of a substance, also known as latent heat, is a measure of the energy input, typically heat, which is necessary to convert a substance from solid to liquid state.
The melting point of a substance is the temperature at which it changes state from solid (crystalline) to liquid (isotropic melt).melting temperature range of HDPE and PP.
Identify
The Identify database, included in Proteus® software, is a unique package with currently about 1,300 entries on ceramics, metals, metallig compounds, polymers, as well as other inorganic and organic substances. This tool helps users identify and classify the materials measured with just a few clicks. In addition, there is an optional library with DSC measurements on 1,150 different polymer products (169 polymer types). In this work, the Identify database is used to assign the peaks gained from PeakSeparation to the polymers present before quantifying their content in the measured samples.
TM-DSC
During a TM-DSC measurement, a periodical temperature modulation is applied over the conventional linear heating and cooling ramp. The total heat flow can thus be separated in a reversing and non-reversing component. The reversing component of the total heat flow is mainly related to the sample’s heat capacity (as a material property) and the non-reversing component of the total heat flow is capturing irreversible phenomena such as recrystallization or crystal annealing.
Since melting processes show both a reversing and a non-reversing signal share, TM-DSC experiments were carried out on the pure HDPE and the PP samples in order to reveal the temperature range at which melting truly appears.
The TM-DSC experiments of the PP100 and PE100 samples were performed according to the temperature and gas program for the mixtures shown in table 2, whereas the heating segments were modified by using an additional amplitude of 0.5 K and a frequency of 0.05 Hz (20 s period) in order to generate the periodic temperature course.
Table 2: Temperature program of the DSC experiments on the HDPE-PP mixtures
| Step | Temperature | Heating rate /dwell times | P2 + Performance-Graded (PG) BinderA performance-based asphalt grading system intended to minimize the potential for rutting, fatigue cracking and thermal cracking as initially defined by Superpave under AASHTO M-320 and M-332 including later equivalents by ASTM, EN, DIN, etc.PG [ml] |
| 1. Dynamic cooling | 30°C ↘ -70°C | 10 K/min | 40 + 60 N2 |
| 2. IsothermalTests at controlled and constant temperature are called isothermal.Isothermal step | -70°C | 10 min | 40 + 60 N2 |
| 3. Dynamic heating | -70°C ↗ 220°C | 10 K/min | 40 + 60 N2 |
| 4. Dynamic cooling | 220°C ↘ -70°C | 10 K/min | 40 + 60 N2 |
| 5. IsothermalTests at controlled and constant temperature are called isothermal.Isothermal step segment | -70°C | 10 min | 40 + 60 N2 |
| 6. Dynamic heating | -70°C ↗ 220°C | 10 K/min | 40 + 60 N2 |
Measurement Results
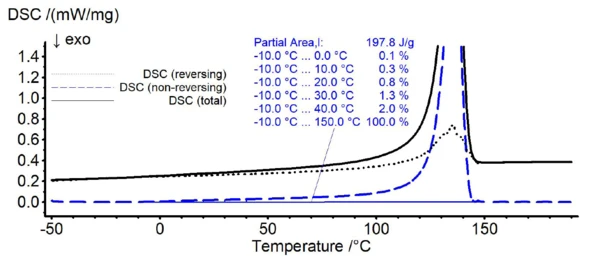
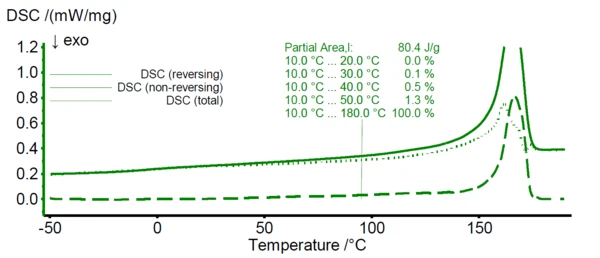
In figure 1, the TM-DSC results of pure HDPE are shown. While the solid line represents the total DSC signal, the dotted and dashed lines reveal the reversing and non-reversing signal of the total heat flow, respectively. For HDPE, melting starts already at about 0°C as can be seen from the emerging non-reversing signal at this temperature (dashed line). In case of PP (see figure 2), the non-reversing signal emerges at about 30°C.
Based on the findings of these TM-DSC measurements, the lower temperature limit for the melting range of the HDPE/PP polymer blends during the peak separation step is defined as 30°C. Here, the non-reversing signal of HDPE starts to exceed about 1% of its total integral value revealing a significant melting at this temperature.
In figure 3, the DSC measurement of PE20 sample is shown with a black solid curve. The PeakSeparation function is applied (30°C to 190°C, linear baseline, 2 peaks with asymmetric shape) to reveal the blue curve which represents the PE component and the green curve at higher temperatures which represents the PP component. The red curve reflects the superimposition of both the blue and green curve as a fit function to the actually measured DSC signal (black curve).
At this point, the new mathematically generated peaks can be selected for comparison with entries of the Identify database, shown as an example in figure 3 with the left blue peak. The database identifies the component as HDPE and visualizes the DSC curve of the HDPE database entry in pink color for direct comparison as also seen in figure 3. While in this work, the polymer blends are of known composition, the user may use these features to identify the individual components, which is necessary for the following compositional analysis/quantification.
To quantify the HDPE and PP proportions in the PE20 sample in a first step, the area of the left blue HDPE peak (obtained by PeakSeparation) is calculated. The obtained value (44.0 J/g) then needs to be divided by the specific melting enthalpy of the pure HDPE sample. That value can either be measured if the pure sample is available or can be taken from literature. However, literature values can be varying significantly. Since the HDPE/PP blends in this work were obtained by mixing the commercially available pure substances, the specific melting enthalpy of 100% HDPE was measured directly with a value of 221.7 J/g. Thus, the calculated HDPE content in the PE20 sample amounts to 19.8% (44.0/221.7). Simultaneously, the HDPE content for all blends, given in table 1, are determined and summarized in the table 3.
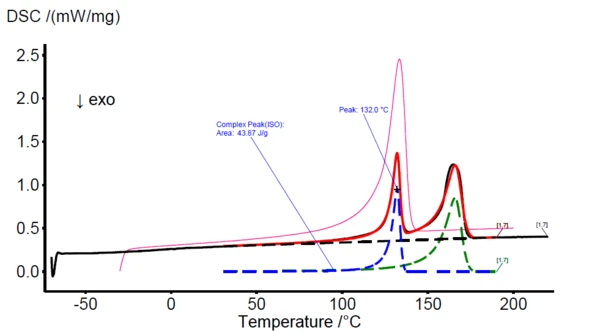
Table 3: HDPE content for the other blend compositions, given in table 1
| Sample | PE10 | PE20 | PE30 | PE40 | PE50 | PE60 | PE70 | PE80 | PE90 |
| % PE actual | 10.3 | 20.5 | 30.0 | 40.2 | 49.8 | 60.0 | 71.0 | 79.1 | 89.9 |
| % PE calculated | 9.7 | 19.8 | 29.2 | 39.4 | 49.3 | 57.3 | 70.5 | 79.5 | 88.0 |
Conclusion
With the help of PeakSeparation, overlapping effects can be well separated, allowing for more precise determinaton of the individual thermal effects like melting peaks. The different curve profiles available contribute to the determinatin of a suitable curve profile for the measured curve. This software feature is easy-to-use and provides added value to the Proteus® analysis software.
The calculated HDPE and PP shares obtained by PeakSeparation with two peaks summarized in table 2 and the identification using the Identify feature show a very good match with the actual composition. TM-DSC is best known for distinguishing between simultaneously occurring reversing and non-reversing effects (e.g., Glass Transition TemperatureThe glass transition is one of the most important properties of amorphous and semi-crystalline materials, e.g., inorganic glasses, amorphous metals, polymers, pharmaceuticals and food ingredients, etc., and describes the temperature region where the mechanical properties of the materials change from hard and brittle to more soft, deformable or rubbery.glass transition and RelaxationWhen a constant strain is applied to a rubber compound, the force necessary to maintain that strain is not constant but decreases with time; this behavior is known as stress relaxation. The process responsible for stress relaxation can be physical or chemical, and under normal conditions, both will occur at the same time. relaxation). However, in this example, temperature modulation is used to precisely reveal the onset of melting which is sometimes difficult to determine visually due to the broad peaks with elongated shoulders to lower temperatures as often seen for polymers. Thereby it was shown that TM-DSC provides a means to improve the prediction quality by refining the analysis range.