17.09.2020 von Dr. Natalie Rudolph, Milena Riedl
Measuring Viscoelastic Properties of Fiber-Reinforced Epoxy
When it comes to the characterization of fiber reinforced composites with dynamic measuring techniques many options are available, but they all have pros and cons for different materials and applications. In their paper, Huayamares et al. set out to answer some relevant questions by comparing measurements in 3-point bending and torsion mode. We summarize the main findings of the scientific paper and explain the measurements as well as the corresponding interpretation of the results depending on the use case.
When it comes to the characterization of fiber reinforced composites with dynamic measuring techniques many options are available, but they all have pros and cons for different materials and applications. In their paper “Comparison between 3-point bending and torsion methods for determining the viscoelastic properties of fiber-reinforced epoxy” Sebastian Huayamaresa, Dominik Grunda and Iman Tahaa,b set out to answer some relevant questions by comparing measurements in 3-point bending and torsion mode. The full paper is available here!
In this blog article, we summarize the main findings of the scientific paper and explain the measurements carried out with the NETZSCH DMA 242E Artemis as well as the corresponding interpretation of the results depending on the use case.
Carbon fiber-reinforced and glass fiber-reinforced epoxy composites are vastly used in the space, aviation and automotive sector for their high performance. Their high strength and stiffness due to the load bearing fibers and the low weight and corrosion resistance due to the polymer matrix lead to their favorable mechanical properties. The final properties mostly depend on the fiber content, the fiber orientation as well as the fiber-matrix adhesion that is responsible for the load transfer between the fibers. For quality control, it is pivotal to check the achieved mechanical performance after manufacturing. One easy way is using Dynamic Mechanical Analysis (DMA), because of the small sample size and additional information such as the glass transition and the viscoelastic behavior of the final composite that can be analyzed.
Introduction to the used measuring techniques
Dynamic Mechanical Analysis
Dynamic mechanical analysis is a technique used to determine the viscoelastic properties of polymers and composites. The storage modulus E’, Viscous modulusThe complex modulus (viscous component), loss modulus, or G’’, is the “imaginary” part of the samples the overall complex modulus. This viscous component indicates the liquid like, or out of phase, response of the sample being measurement. loss modulus E” and loss factor δ in correlation with the glass transition temperature Tg can be detected using several measurement modes. The most common are 3 point bending or cantilever, compression, torsion, but also tension and shear. In comparison to classical mechanical testing, dynamic mechanical analysis uses smaller amounts of material and lower forces to provide extensive information on the composite’s viscoelastic properties. This makes it a very powerful technique for quality control and for the correlations between the material’s composition and properties.
3-point bending
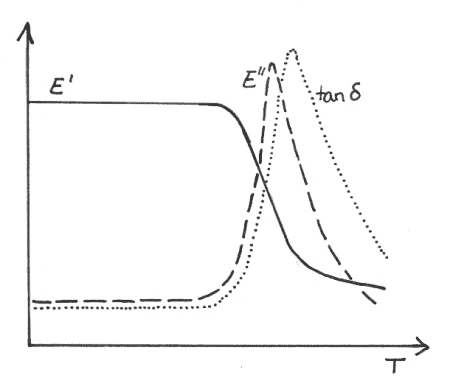
In the study, these properties are determined using a NETZSCH DMA 242E Artemis in 3-point bending mode. This mode is the most common test method, because it puts the sample under a combined compression-tension load and therefore, provides the tensile moduli E’ and E” as well as the damping factor tanδ as seen in Figure 1. The glass transition Tg can be identified as the inflection point in the E’ curve or as the maximum in the E” curve. During the loading operation, the top surface of the sample beam is in compression and the bottom surface in tension. In order to avoid significant shear stresses, the sample width-to-thickness ratio for stiff samples such as composites should be 10:1.

Torsion
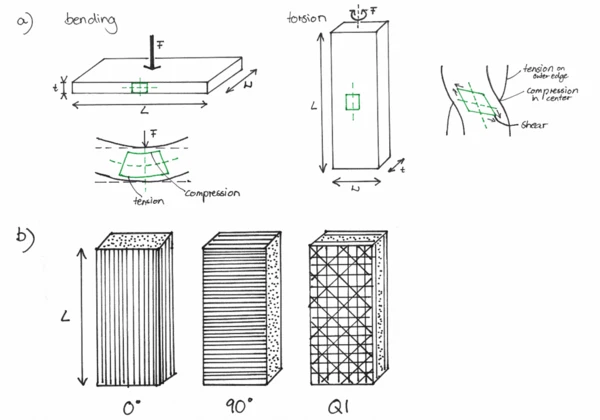
In addition, the samples were investigated in torsion mode, which requires a complete separate measurement setup. The loading is more complex in torsion as tension, compression, shear and flexural loading acts on the sample beam at the same time. The sample experiences tension on the outer sample edge, compression in the center, a twist along the longitudinal axis and the failure occurs in shear. A comparison between bending and torsion mode and its effect on the sample deformation is highlighted in green Figure 2a.

A sample measured in 3-point bending vs. torsion theoretically exhibits the same transition temperatures and changes in moduli and loss factor shown in Figure 1. However, it gives the shear modulus G’, G”.
The relation between tensile modulus E and shear modulus G is:
E = 2 ∙ G ( 1 + μ )
The Poisson’s ratio µ is a dimensional number that relates the transverse deformation to axial deformation. For stiff and brittle values µ is close to 0 and thus the factor is almost 2 (E=2G). For liquid materials, such as the melted polymer matrix µ is close to 0.5 and thus the factor is almost 3 (E=3G). For most fiber reinforced composites the Poisson’s ratio µ equals 0.1…0.3 at room temperature. Therefore, the values of G should be less than 50% of E.
Questions to ask when measuring Fiber-Reinforced Epoxy
What orientation do the fibers have?
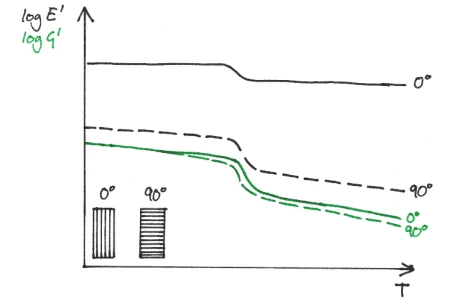
Unidirectional fiber orientation: It was found that “the torsion method cannot distinguish between the effect of fiber orientation and associated reinforcement” [1] measured perpendicular and parallel in the clamp for UD samples shown in Figure 2 b as 0° and 90°. In contrast, 3-point-bending measured by DMA shows a clear distinction. Furthermore, “the storage and loss moduli measured by torsion were expectedly lower than those measured by 3-point bending” [1]. However, while U-GFR 0° E » 60 GPa is as expected for the composite material, G is much lower than expected (E » 10G). In the matrix dominated case (U-GFR 90° E » 20 GPa), the correlation is as expected (E = 3 G). One explanation could be the low width-to-thickness ratio of the torsion samples.

Quasi-isotropic fiber orientation: Both methods are suitable to reflect the effect of fiber type (stiffness) on the dynamic properties of the composites. However, the absolute values of the storage modulis, again do not correlate and thus the torsion results are only to be accepted as a qualitative identification of differences.
What role does sample preparation play?
Not only is the fiber orientation of the material crucial in choosing the method that produces the most consisting results, but sample preparation and thus, availability of sufficient material are equally important.
“Special attention is required regarding the sample preparation, since results are very sensitive to variations in sample width and thickness. This study showed that an irregular sample width can result in large scatterings in the values of the storage modulus” [1].
Good dimensional accuracy
3-point-bending tests with DMA of the five U-GFR epoxy samples in 0° orientation showed “significant differences in the storage moduli of two of the samples” [1].
Further analysis with stereo microscopy revealed that the two samples “had > 0.5 mm deviation in width and exhibited differences of over 30% in E’” [1], while the other samples only showed minor variations. This finding is “in agreement with other investigations, which report that sample dimensions are critical for the accuracy of flexural DMA testing” [1].
Effect of sample length
The effect of sample length was examined using different sample lengths in torsion. “An increase of span length […] resulted in a higher deflection angle […] measured by the instrument, which compensates for the larger span length […], resulting in similar Complex Shear Modulus (G*)Shear modulus is a measurement of the stiffness of a material. complex shear modulus, storage modulus and Viscous modulusThe complex modulus (viscous component), loss modulus, or G’’, is the “imaginary” part of the samples the overall complex modulus. This viscous component indicates the liquid like, or out of phase, response of the sample being measurement. loss modulus. […] Based on these observations, it can be noted that the viscoelastic properties of composites measured in torsional mode are not affected by sample length, regardless of fiber orientation” [1] as long as the width-to-thickness ratio is kept constant.
Taken together, each method has its strengths and weaknesses depending on the composite type under investigation. “3-point bending proved to be more suitable to detect the important effect of fiber orientation for unidirectional fiber-reinforced epoxy. [1]” It also showed the sensitivity to sample preparation. Careful control of sample dimensions are required for consistency. Torsion has shown to qualitatively give the same results. However, the absolute modulus values are not in agreement with the known correlation. Its strength can be seen in measurements of material that will be used for parts under torsion load as well as for samples where very little material is available and the size of the samples needs to be further minimized.
A word on measuring glass transition temperatures
The glass transition temperature can be determined accurately by both test methods studied. The inflection point of the E’/G’ curve and the peak of the E’’/G” curve of both 3-point bending and torsion can be used for determining Tg with good accuracy for carbon and glass fiber-reinforced epoxy composites, Figure 1. This implies that despite the variation in the absolute values of the viscoelastic properties, the temperature dependence of characteristic transitions remains valid.
Affiliations
a Fraunhofer IGCV, Fraunhofer Research Institution for Casting, Composite and Processing Technology IGCV, Am Technologiezentrum 2, 86159, Augsburg, Germany
b Ain Shams University, Faculty of Engineering – Design and Production Engineering Department, El Sarayat Str. 1, 11517 Cairo, Egypt