
Proteus® Now Quantify
Tutorials
Our step-by-step tutorials help you get the most out of Proteus® Now Quantify. From setting up reliable DSC measurements to choosing the right parameters and preparing your data for upload – each guide gives you practical tips for accurate, reproducible, and efficient thermal analysis.
Explore the tutorials below and find answers to the most common questions in your daily workflow.
Tutorial 1: How to Get a Reliable DSC Measurement Result
A good DSC measurement is the foundation for meaningful thermal analysis – and for getting the best results with Proteus® and Proteus® NowQuantify. This guide explains the essential requirements for sample preparation, instrument setup, and calibration to ensure high-quality and reproducible DSC curves.
1. Prepare Your Sample Correctly
✔ Choose pellets if possible
Recyclate pellets are already compounded and homogenized, meaning they represent the overall material composition reliably.
Flakes or powders (regrind), however, are not homogenized. Each flake may come from a different material or part, so results can vary depending on which flake you select or from where the sample was taken.
If only flakes are available: use several flakes, check repeatability, and be cautious in interpreting results.
✔ Sample mass: 10 ± 1 mg
This mass range is optimized for Quantify and was used for training the ML models.
Smaller → weak signal, poor representativeness.
Larger → broadened peaks, shifts in transition temperatures.
💡 Tip: Weigh samples precisely. Deviations >0.1 mg can already influence comparability.
📦 Samples with fillers
Inorganic fillers such as CaCO₃, talc, or glass fibers do not produce a DSC fingerprint. If present, they reduce the accuracy of Quantify.
To obtain meaningful results, determine the filler fraction separately (e.g., with TGA or muffle furnace ash analysis) and subtract it from the sample mass before analysis. More details can be found in Tutorial: Special Considerations for Recyclates.
2. Select the Right Crucible and Atmosphere
✔ Crucible: Al Concavus® with pierced lid
Ensures reproducible contact with the sensor.
The pierced lid allows controlled gas exchange and prevents overpressure.
✔ Atmosphere: Nitrogen
Use an inert nitrogen atmosphere with default gas flows (e.g. protective 60 ml/min, purge 40 ml/min). This avoids unwanted OxidationOxidation can describe different processes in the context of thermal analysis.oxidation and ensures stable heat transfer.
3. Check Calibration Before Measurement
For reliable quantitative results, the DSC must be properly calibrated:
- Heat flow calibration (sensitivity) ensures enthalpies are correct (J/g).
- Temperature calibration (TempCal) ensures onset, melting, and Glass Transition TemperatureThe glass transition is one of the most important properties of amorphous and semi-crystalline materials, e.g., inorganic glasses, amorphous metals, polymers, pharmaceuticals and food ingredients, etc., and describes the temperature region where the mechanical properties of the materials change from hard and brittle to more soft, deformable or rubbery.glass transition temperatures are correct.
- Be-Flat for the baseline calibration
💡 Tip: Calibrate regularly (e.g. monthly or after maintenance) and document calibration files in Proteus®.
4. Use the Standard Heating and Cooling Rate (10 K/min)
For Quantify analysis, a heating and cooling rate of 10 K/min is mandatory.
This rate was used to generate the reference dataset and to train the machine-learning models behind Quantify. It represents a widely accepted DSC standard and provides a good balance between resolution and measurement time.
Using different rates can:
- shift transition temperatures,
- change peak shapes and enthalpies,
- reduce comparability with the Quantify reference data.
👉 To ensure reliable and comparable results, always measure at 10 K/min.
The full Quantify-ready measurement program, including heating and cooling segments and IsothermalTests at controlled and constant temperature are called isothermal.isothermal holds, is described in Tutorial: How to Run a DSC Measurement for Quantify Analysis.
5. Verify After Measurement
Check the final sample weight. Losses may indicate evaporation or Decomposition reactionA decomposition reaction is a thermally induced reaction of a chemical compound forming solid and/or gaseous products. decomposition.
Inspect the DSC curve carefully. Look for smooth baselines, clear transitions, and low noise.
If results look unusual, repeat the measurement with a second sample to confirm.
Tutorial 2: How to Choose the Right Temperature Limits for My Sample
Selecting the correct temperature range is one of the most important steps when setting up a DSC measurement. If the limits are too narrow, important transitions may be missed. If they are too wide, the sample may decompose or contaminate the DSC cell.
This guide explains how to define start and end temperatures that ensure reliable results, especially for unknown recyclates.
1. General Rules for Setting Temperature Limits
✔ Start Temperature
At least 50 °C below the first expected transition (or 5× the heating rate).
Include an IsothermalTests at controlled and constant temperature are called isothermal.isothermal hold of 5 minutes before starting the heating ramp.
For polymers with very low Glass Transition TemperatureThe glass transition is one of the most important properties of amorphous and semi-crystalline materials, e.g., inorganic glasses, amorphous metals, polymers, pharmaceuticals and food ingredients, etc., and describes the temperature region where the mechanical properties of the materials change from hard and brittle to more soft, deformable or rubbery.glass transition temperatures (e.g. EVA, LDPE), cooling may need to go well below 0 °C.
✔ End Temperature
At least 30 °C above the last expected transition.
Avoid Decomposition reactionA decomposition reaction is a thermally induced reaction of a chemical compound forming solid and/or gaseous products. decomposition. Stop before visible degradation such as smoke, residue, or unusual baseline drift.
💡 Tip: If the composition is unknown (typical for recyclates), use TGA to check Thermal StabilityA material is thermally stable if it does not decompose under the influence of temperature. One way to determine the thermal stability of a substance is to use a TGA (thermogravimetric analyzer). thermal stability. If no TGA is available, start with a wider range and refine it in later measurements.
According to ISO 11357-2:2020, the start temperature should be at least 50 °C (or 5× heating rate) below the first transition, and the end temperature about 30 °C (or 5× heating rate) above the last transition.
2. Special Considerations for Recyclates
Unknown blends may require a wide start temperature (e.g. –40 °C) and an end temperature above the highest polymer expected in the mix.
The risk of Decomposition reactionA decomposition reaction is a thermally induced reaction of a chemical compound forming solid and/or gaseous products. decomposition is especially relevant for PVC, PVDC, or contaminated samples. In such cases, stop early (e.g. around 120 °C) if the goal is to observe the Glass Transition TemperatureThe glass transition is one of the most important properties of amorphous and semi-crystalline materials, e.g., inorganic glasses, amorphous metals, polymers, pharmaceuticals and food ingredients, etc., and describes the temperature region where the mechanical properties of the materials change from hard and brittle to more soft, deformable or rubbery.glass transition without degradation.
Ensure the end temperature is not so high that the furnace becomes contaminated, particularly when working with unknown recyclates.
Running far above Decomposition reactionA decomposition reaction is a thermally induced reaction of a chemical compound forming solid and/or gaseous products. decomposition can cause sensor contamination and baseline drift and may require cleaning and recalibration. Always balance information gained against instrument protection.
3. Examples of Good vs. Poor Temperature Limits
✔ Good Example: PET recyclate
Start: 0 °C
End: 290 °C
Result: clear Tg (~70 °C), cold CrystallizationCrystallization is the physical process of hardening during the formation and growth of crystals. During this process, heat of crystallization is released.crystallization, and melting peak (~250–260 °C).
❌ Poor Example 1: End temperature too low
PET heated only to 240 °C. The melting peak is cut off and Quantify cannot analyze the data properly.
❌ Poor Example 2: End temperature too high
PET heated to 350 °C. Decomposition reactionA decomposition reaction is a thermally induced reaction of a chemical compound forming solid and/or gaseous products. Decomposition begins, baseline drift occurs, and residue contaminates the crucible.
Tutorial 3: How to Run a DSC Measurement for Quantify Analysis
This checklist summarizes the mandatory requirements for running a DSC measurement that is compatible with Proteus® Now Quantify.
Quantify Measurement Checklist
✅ Method Parameters (mandatory)
- Sample weight: 10 ± 1 mg
- Heating and cooling rate: 10 K/min
- Atmosphere: Nitrogen (default gas flows)
- Crucible: Al Concavus®® with pierced lid
- Sensitivity and TempCal valid, BeFlat® turned on
⚠️ These parameters are fixed for Quantify. Deviations can change peak shapes and reduce prediction reliability.
✅ Before Uploading to Quantify
- Curve quality is acceptable:
- smooth baseline
- clear transitions
- no visible Decomposition reactionA decomposition reaction is a thermally induced reaction of a chemical compound forming solid and/or gaseous products. decomposition or excessive noise
- Start and end temperatures comply with Tutorial 2
- Sample weight is entered correctly in Proteus®
- File exported using “Export to Proteus® Now Quantify”
(Proteus® version 9.8 or higher)
If decomposition or strong noise is observed, reduce the end temperature and repeat the measurement before uploading.
Tutorial 4: Special Considerations for Recyclates
Recyclates are rarely as clean and well-defined as virgin polymers. They may contain blends, inorganic fillers, impurities, or polymers not yet covered by the Quantify training datasets. These factors can complicate DSC measurements and the interpretation of results.
This tutorial explains the key limitations, risk factors, and how to interpret Quantify results correctly when working with recyclates.
1. Blends and Unsupported Polymers
Recyclates often contain mixtures of several polymers, such as PE/PP blends or multilayer materials.
Quantify is trained on a defined set of virgin polymers and selected blends. Polymer types outside this dataset cannot be recognized or quantified.
If such mixtures are suspected, the DSC measurement should still be performed. Quantify will analyze all supported components and flag unaccounted peaks for further investigation using Proteus® Identify .
Expert Info: The hardest cases – HDPE and LLDPE
Quantify can detect contaminations down to approximately 1% in many systems. However, when polymers are structurally very similar, separation becomes extremely difficult.
Example: 1% LLDPE in HDPE
Both materials are linear polyethylenes with very similar CrystallizationCrystallization is the physical process of hardening during the formation and growth of crystals. During this process, heat of crystallization is released.crystallization behavior. They co-crystallize into a common crystalline phase rather than forming separate melting domains.
As a result, the DSC curve shows a single melting peak instead of two. The minor component has no distinct thermal fingerprint and cannot be separated reliably.
Takeaway: Very similar polymers may remain indistinguishable in DSC, even with Quantify. In such cases, complementary techniques (e.g. FTIR or HPLC) are recommended.
Expert Info: High variability – PP-H and PP-C
Compared to polypropylene homopolymers (PP-H), polypropylene copolymers (PP-C) exhibit broader and more complex thermal behavior. Comonomers disrupt Crystallinity / Degree of CrystallinityCrystallinity refers to the degree of structural order of a solid. In a crystal, the arrangement of atoms or molecules is consistent and repetitive. Many materials such as glass ceramics and some polymers can be prepared in such a way as to produce a mixture of crystalline and amorphous regions.crystallinity, shift melting and CrystallizationCrystallization is the physical process of hardening during the formation and growth of crystals. During this process, heat of crystallization is released.crystallization peaks, and often produce less distinct transitions.
In addition, PP-C grades vary widely (random, block, impact, blends), leading to highly variable thermograms that are harder to represent in a single predictive model.
Takeaway: Quantify can provide meaningful insights into PP-C, but precise predictions require larger and more representative training datasets than for PP-H. Accuracy will continue to improve as additional PP-C data is incorporated.
2. Samples with Fillers
Inorganic fillers such as CaCO₃, talc, or glass fibers do not produce a DSC fingerprint. Their presence reduces the polymer fraction in the sample and can distort Quantify results.
To obtain meaningful output, determine the filler content separately and subtract it from the sample weight before analysis.
Typical methods:
- TGA (thermogravimetric analysis)
- Muffle furnace ash test
Expert Info: Model limitation
Quantify does not yet integrate fillers into its predictions. Correcting the polymer mass is therefore essential. Full filler support is part of the product roadmap.
3. Impurities and Degradation
Recyclates may contain additives, stabilizers, or degradation products. These can cause extra peaks, broader transitions, or noisy baselines.
Always evaluate the second heating curve carefully.
Expert Info: Degradation mechanisms
Degradation can influence melting behavior in different ways:
- Chain scission (thermal or oxidative):
→ lower molecular weight → lower Melting Temperatures and EnthalpiesThe enthalpy of fusion of a substance, also known as latent heat, is a measure of the energy input, typically heat, which is necessary to convert a substance from solid to liquid state. The melting point of a substance is the temperature at which it changes state from solid (crystalline) to liquid (isotropic melt).melting temperature and enthalpy - Polycondensation or radical post-condensation (e.g. PET, PA):
→ higher molecular weight → higher Melting Temperatures and EnthalpiesThe enthalpy of fusion of a substance, also known as latent heat, is a measure of the energy input, typically heat, which is necessary to convert a substance from solid to liquid state. The melting point of a substance is the temperature at which it changes state from solid (crystalline) to liquid (isotropic melt).melting temperature and sometimes higher enthalpy
In practice, reprocessing studies show that these effects are often smaller than the natural variability between polymer grades. Quantify’s training data accounts for this variation, so moderate degradation usually remains within model tolerance.
💡 Tip: If strong degradation occurs, reduce the end temperature (see Tutorial: How to Choose the Right Temperature Limits for My Sample) to protect the crucible and furnace.
4. Practical Workflow for Recyclates
When working with recyclates, the standard Quantify workflow applies, with additional attention to the following points:
- Sample homogeneity (pellets vs flakes)
- Presence of fillers
- Curve quality of the second heating
- Unexplained peaks or anomalies
Unsupported components or suspicious features should be analyzed further using Proteus® Identify.
(Measurement execution and upload steps are described in Tutorial: How to Run a DSC Measurement for Quantify Analysis.)
5. Unsupported Polymers
If the DSC curve contains transitions from a polymer not included in the Quantify dataset, the quantification result will be compromised and inaccurate.
Proteus® Identify can be used to determine which unsupported polymers are present. Quantification will only be possible once that polymer type is included in a future Quantify update.
Expert Info Proteus® Identify
Proteus® Identify compares thermal transitions against a reference library. It is the recommended tool for:
- identifying unsupported polymers, and
- building internal reference databases to detect anomalies and deviations.
⚠️ Risk Check: When Working with Recyclates
- Is the sample homogeneous (pellets) or variable (flakes)?
- Were fillers identified and corrected for?
- Was the standard Quantify method applied?
- Is the second heating curve clean and interpretable?
- Are degradation effects visible?
- Are unsupported polymers present and flagged for follow-up in Proteus® Identify ?
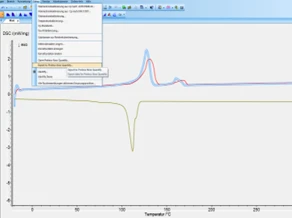
Tutorial 5: How to generate the upload file in Proteus® Analysis
To prepare a measurement file in Proteus® Analysis9.8 or higher for upload into Proteus® Now Quantify, please follow these steps:
1. Switch to the curve view
Open your measurement and go to the view where the heat flow is plotted as a function of temperature.

2. Select a curve
a. Click on the curve you want to export.
b. This will activate the export function: the button in the Extras menu is no longer greyed out.
3.export the measurement
a. Go to Extras → Export to Proteus® Now Quantify
b. Click to export the complete measurement file.
4.save the file
a. Choose a location on your computer and confirm.
b. The file is now ready for upload into Proteus® Now Quantify.