Introduction
Identify is an integral part of the Proteus® analysis system and represents a unique database for Thermal Analyis. With a single click, measurement curves — even those that have not yet been evaluated — can be checked for agreement with stored curves and literature data. Identify can therefore automatically recognize and interpret curves and materials, and can also be employed for quality control. Identify can also be used as an archive and data management system for storing measurements including conditions.
In a nutshell, Identfiy ...
- is a unique database system for Thermal Analysis
- contains more than 2,650 database entries (measurements and literature data)
- offers NETZSCH and user libraries as well as the KIMW polymer database
- covers polymers, organics, foods, pharmaceuticals, metals/alloys, ceramics, inorganics
- supports DSC, TGA, c-DTA®, STA, DIL, TMA, cp, and DMA data types
- can simultaneously incorporate TGA and DSC or c-DTA® during identification
- serves for curve and material identification with a single click
- features Quality Control functionalities (“PASS!”/”FAIL!” validation)
- offers always access to the entire database (including evaluations and measurement conditions)
- allows for filtering database entries
- can overlay measurement curves of several database entries provides customizable reports
More information including application examples can be found on the Identify landing page.
Identification of a Polymer
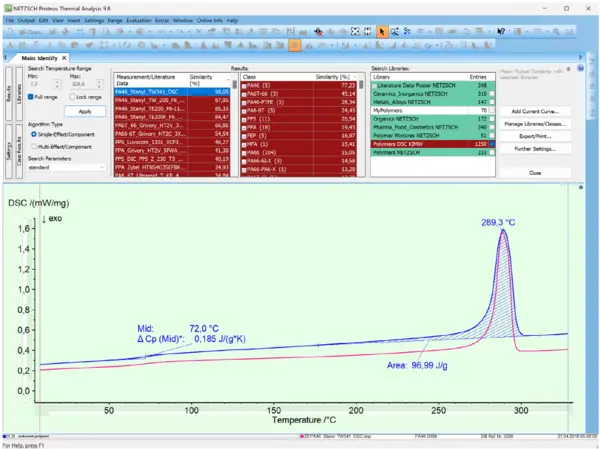
Figure 1 showcases the identification of a polymer from the second heating of a DSC measurement. With a single click, the Glass Transition TemperatureThe glass transition is one of the most important properties of amorphous and semi-crystalline materials, e.g., inorganic glasses, amorphous metals, polymers, pharmaceuticals and food ingredients, etc., and describes the temperature region where the mechanical properties of the materials change from hard and brittle to more soft, deformable or rubbery.glass transition at 72°C and the melting at a peak temperature of 289°C were autonomously evaluated by AutoEvaluation, and the Identify results immediately appeared: The best hit of the database search is the “PA46 Stanyl TW341” polymer product; all other 173 polymer types represented in the selected KIMW database such as PA6T-66 can be ruled out, which enhances the value of the result: It can be stated with a high degree of certainty that the unknown polymer is polyamide of type PA46 since no impurities were detected, for example.
Qualification of a Polymer
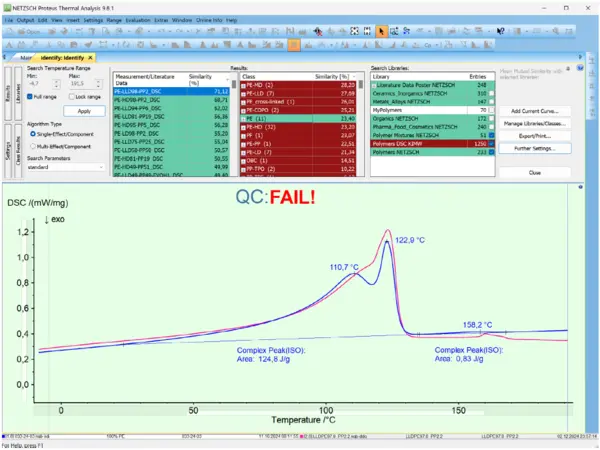
Figure 2 depicts an Identify analysis of a DSC curve measured on a nominally pure polyethylene sample (“100% PE”). The hit list and the overlay with the best match, “PE-LLD98-PP2_DSC” (98% PE-LLD + 2% PP, pink curve), contained in the “Polymer Mixtures NETZSCH” library, show that the material is of type PE-LLD. This result originates from the superimposed melting effects in the DSC curve, with peak temperatures of about 111°C and 123°C. The second result is that the small DSC melting peak near 158°C indicates a polypropylene (PP) content of about 2%. Therefore, the PE-LLD sample was not fully pure polyethylene, but contained contaminations in the form of PP.
In this application example, the user activated the quality control functionality of Identify which automatically triggered the message “QC: FAIL!” (see figure 2). This result appeared because a user-defined similarity threshold with a selected quality control class, PE in this case, was underrun. If the similarity was above the threshold, then the message “QC: PASS!” would have been shown by the software. The low similarity to the PE class of only about 23% is mainly due to the PP contamination found.
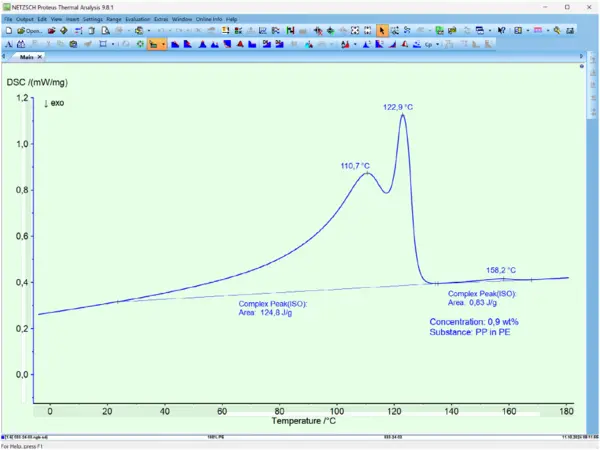
Better quantification of the PP contamination was achieved by analyzing the DSC melting peak at approximately 158°C, shown in figure 2 using the ‘Concentration’ function of Proteus®® analysis. The result is a PP concentration of 0.9%, i.e., around 1% in the sample (see figure 3).
Summary
An overview of the applications and benefits of Identify was provided. In particular, polymer identification and detection of impurities were highlighted, which is useful for quality control and failure analysis. Additionally, the ‘Concentration’ analysis function was showcased, which likewise allows polymers to be quantified from a DSC curve. Further information can be found on the Identify landing page and and also in Software Innovation 028: The New ‘Polymer MIxtures NETZSCH‘ Library for Identify.