Introduzione
La stabilità degli API (ingredienti farmaceutici attivi) e degli eccipienti è direttamente correlata alle condizioni di conservazione: La conservazione a una temperatura inadeguata (troppo calda o troppo fredda) può influire sulla loro efficacia, sicurezza e durata di conservazione. I test di stabilità farmaceutica descritti nelle linee guida dell'OMS (Organizzazione Mondiale della Sanità) e dell'ICH (Consiglio Internazionale per l'Armonizzazione dei Requisiti Tecnici per l'Uso Umano) richiedono un minimo di 6 mesi per essere completati. [1, 2]
Le informazioni iniziali sulla stabilità di una sostanza in condizioni di temperatura specifiche possono essere ottenute entro le prime ore. A tal fine, la cinetica del processo di degradazione della sostanza (Reazione di decomposizioneUna reazione di decomposizione è una reazione termicamente indotta di un composto chimico che forma prodotti solidi e/o gassosi. decomposizione termica, desolvatazione, disidratazione) viene valutata e utilizzata per determinare il suo comportamento durante le isoterme a lungo termine. Ciò consente di effettuare rapidamente la selezione iniziale di API/eccipienti.
Di seguito, viene stabilita la cinetica della reazione di disidratazione del calcio idrogeno fosfato diidrato, CaHPO4-2H2O(detto anche DCP). A tal fine, le misure termogravimetriche effettuate a diverse velocità di riscaldamento sono utilizzate per valutare la cinetica di reazione mediante il software NETZSCH Kinetics Neo.
Condizioni di misura
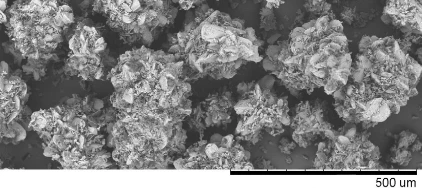
Il DCP è un riempitivo comunemente utilizzato per l'imbottigliamento. La sostanza utilizzata per le misurazioni è stata gentilmente fornita da JRS Pharma (nome commerciale: Emcompress®). Le condizioni sperimentali sono riassunte nella tabella 1.
Tabella 1: Condizioni di prova
Dispositivo | TG 209 F1 Nevio accoppiato allo spettrometro FT-IR di Bruker Optics (PERSEUS® accoppiamento) | TG 209 F1 Nevio |
|---|---|---|
| Campione | DCP Emcompress® (JRS Pharma) | |
| Massa del campione | 3.71 mg | 3.71 mg a 4,30 mg |
| Crogiolo | Concavus® (Al) chiuso con coperchio forato | |
| Programma di temperatura | da 30°C a 300°C | |
| Velocità di riscaldamento | 10 K/min | da 1 K/min a 20 K/min |
Risultati della misurazione
Misura TGA-FT-IR sul DCP
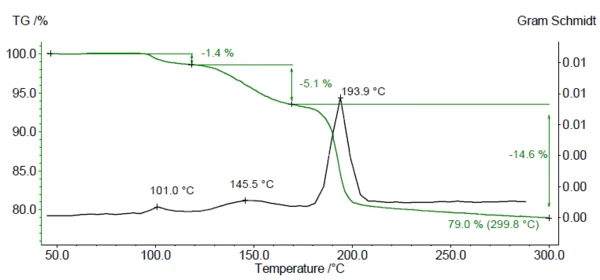
La Figura 1 mostra la curva di perdita di massa (verde) e il grafico di Gram Schmidt (nero) risultanti dalla misurazione TGA-FTIR sul DCP. La curva di Gram Schmidt indica gli intervalli di temperatura in cui sono stati rilevati i gas rilasciati. Tra la temperatura ambiente e i 300°C sono visibili tre fasi di perdita di massa, corrispondenti a tre massimi nel grafico di Gram-Schmidt. La massa residua misurata del 79% corrisponde alla massa residua teorica dopo la perdita di 2H2Odal DCP.
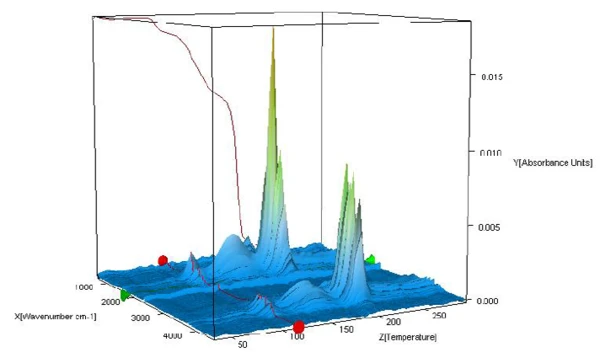
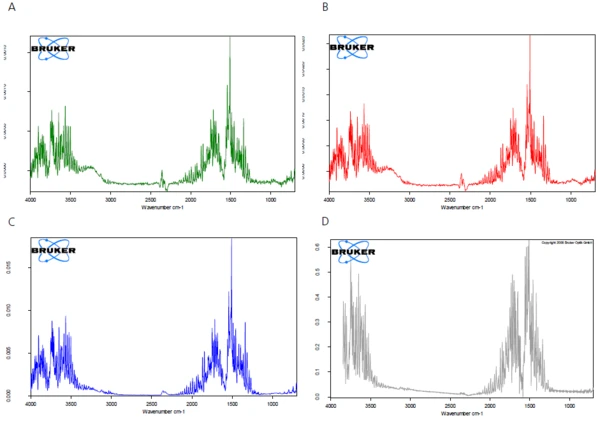
Gli spettri FT-IR dei prodotti rilasciati durante il riscaldamento vengono analizzati per verificare se in questo intervallo di temperatura viene rilasciata solo acqua o anche altri componenti. La Figura 2 mostra gli spettri FT-IR delle sostanze rilasciate durante la misurazione come una vista tridimensionale. L'estrazione degli spettri a diverse temperature mostra che le fasi di perdita di massa rilevate sono dovute solo all'evoluzione dell'acqua (cfr. figure 3A, 3B e 3C, spettri FT-IR delle sostanze rilasciate a 110°C, 159°C e 205°C e 3D, spettro di confronto dell'acqua dal sito EPA-NIST library).
È noto in letteratura [4] che l'acqua di superficie e l'acqua strutturale iniziano a lasciare la struttura cristallina intorno agli 80°C, momento in cui inizia a formarsi una fase amorfa. La quantità di sostanza nella fase amorfa aumenta durante la Reazione di decomposizioneUna reazione di decomposizione è una reazione termicamente indotta di un composto chimico che forma prodotti solidi e/o gassosi. decomposizione fino a 200-220°C e varia con la velocità di riscaldamento.
Analisi cinetica del processo di disidratazione
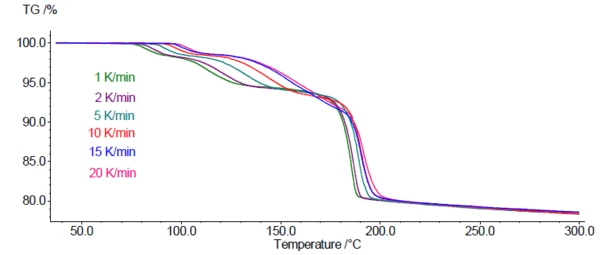
La Figura 4 mostra le curve di misurazione TGA per il DCP a 6 diverse velocità di riscaldamento tra 1 e 20 K/min. Come previsto per questo processo cinetico, le fasi di perdita di massa si spostano verso temperature più elevate con l'aumento della velocità di riscaldamento.
Questa dipendenza delle fasi di perdita di massa dalla velocità di riscaldamento consente di utilizzare le curve TGA per un'analisi cinetica della disidratazione. A tale scopo, è stato utilizzato il software Kinetics Neo (di NETZSCH-Gerätebau GmbH). Il software è in grado di assegnare a ogni singola fase diversi tipi di reazione con parametri cinetici propri, come l'energia di attivazione, l'ordine di reazione e il fattore pre-esponenziale. Sulla base dei risultati, Kinetics Neo è in grado di simulare la reazione (o le reazioni) per programmi di temperatura specificati dall'utente, ad esempio isoterme di lunga durata a una temperatura specifica.
Le seguenti osservazioni aiutano a determinare il numero e il tipo di fasi della cinetica.
- La presenza di tre fasi di perdita di massa suggerisce che il processo si svolge in almeno tre fasi.
- Il fatto che le curve a bassa velocità di riscaldamento si intersechino con quelle ad alta velocità di riscaldamento (si veda l'intervallo di temperatura 150°C-190°C) indica che una fase di reazione dovrebbe essere descritta da un modello di reazione competitiva o parallela.
- Dopo la terza fase di perdita di massa, la massa continua a diminuire; questo può essere descritto da un'ulteriore fase nel modello cinetico.
Alla fine è stato individuato il seguente modello per descrivere al meglio il processo:
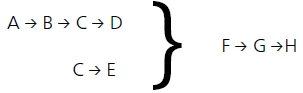
- Il passo di reazione A → B descrive il primo passo di perdita di massa della curva TGA e deriva dal rilascio di acqua superficiale.
I passi di reazione
B → C → D
C → E
possono corrispondere ai passi descritti da Rabatin et al. [3]:
CaHPO4 - 2H2O→ CaHPO4- xH2O+ (2-x)H2O(I)
H2O(I) →H2O(g)
che porta alla formazione di diverse quantità stechiometriche di acqua con CaHPO4 -H2O[prodotto D] e CaHPO4 - yH2O[prodotto E].
Inoltre, è iniziata la formazione della fase amorfa, che dipende dalla velocità di riscaldamento. Più bassa è la velocità di riscaldamento, più lunga è la durata della fase amorfa. La diversa durata della fase amorfa, derivante dalle diverse velocità di riscaldamento, può essere responsabile dei diversi valori TGA dopo la seconda fase di Reazione di decomposizioneUna reazione di decomposizione è una reazione termicamente indotta di un composto chimico che forma prodotti solidi e/o gassosi. decomposizione a 180°C e della Reazione di decomposizioneUna reazione di decomposizione è una reazione termicamente indotta di un composto chimico che forma prodotti solidi e/o gassosi. decomposizione in modi paralleli. Nella cinetica Neo, i prodotti D ed E sono descritti con F (F = D + E). - La temperatura di rilevamento della terza fase di perdita di massa è coerente con la misurazione DTA descritta da Rabatin et al. [3], in cui è stato rilevato un picco a 195°C. Gli autori hanno associato questo picco al seguente meccanismo: CaHPO4- xH2O→ CaHPO4 (amorfo) + xH2O
Questo, a sua volta, è correlato con il passaggio F → G della cinetica Neo. - La fase di reazione G → H descrive la continua diminuzione di massa al di sopra dei 200°C.
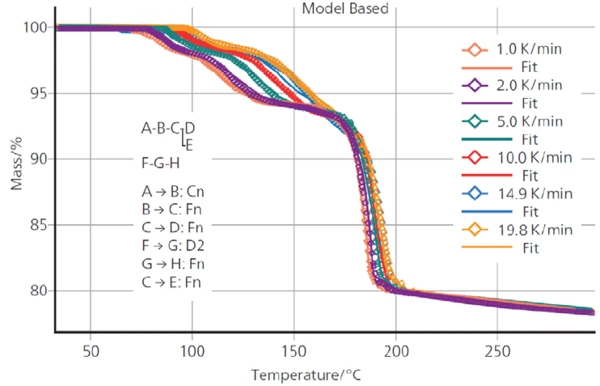
La Figura 5 mostra il buon adattamento tra le curve TGA misurate e quelle calcolate da Kinetics Neo utilizzando il modello cinetico descritto. Il coefficiente di correlazione tra le curve misurate e calcolate è pari a 0,999.
I parametri di ciascuna fase di reazione calcolati da Kinetics Neo sono riassunti nella Tabella 2.
Tabella 2: Parametri cinetici delle fasi di reazione
| Fase di reazione | A → B | B → C | C → D | D → E | F (D+E) → G | G → H |
| Tipo di reazione | ordine n-esimo con autocatalisi | ordine n-esimo | ordine n-esimo | ordine nono | diffusione | ordine nono |
| Energia di attivazione [kJ-mol-1] | 144.8 | 104.2 | 111.3 | 50.7 | 611.9 | 19.9 |
| Log (fattore preesponenziale) | 17.9 | 11.5 | 11.9 | 0.5 | 67.2 | 4.1 |
| Ordine di reazione | 1.59 | 0.43 | 0.91 | 0.01 | - | 3.17 |
| Contributo | 0.063 | 0.067 | 0.150 | 0.235 | 0.495 | 0.182 |
Dalla valutazione della cinetica alla previsione del comportamento del campione
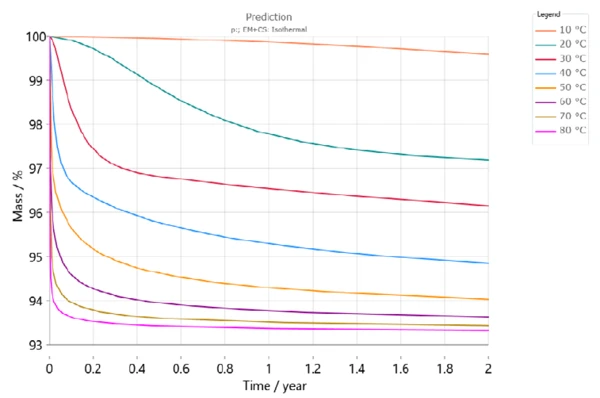
La conoscenza della cinetica di reazione consente di simulare il processo di disidratazione per qualsiasi programma di selecttemperatura, comprese le isoterme di lunga durata.
La Figura 6 mostra la disidratazione del DCP nel corso di due anni per diverse temperature di stoccaggio. Secondo questa simulazione, si avrà una perdita di massa superiore al 3% dopo 6 mesi a una temperatura di stoccaggio di 30°C (curva rossa). A 50°C, invece, la perdita di massa sarà già superiore al 5% nello stesso periodo (arancione chiaro).
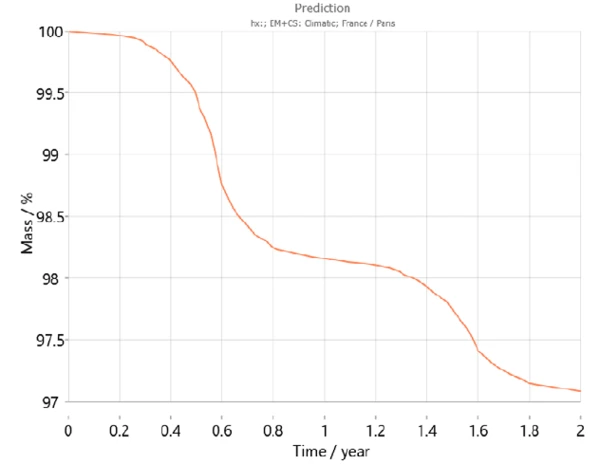
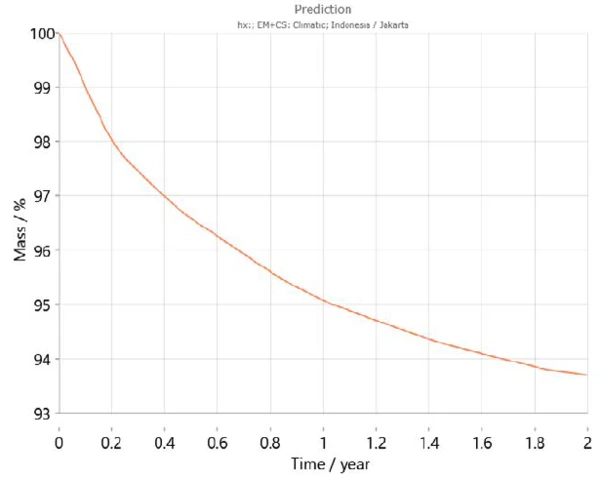
Inoltre, Kinetics Neo contiene una mappa climatica che tiene conto dell'andamento della temperatura media negli ultimi anni per le diverse regioni del mondo, comprese le variazioni di temperatura durante l'anno. Utilizzando queste informazioni, Kinetics Neo è in grado di adattare le sue previsioni sul comportamento dei campioni per un determinato Paese. Ad esempio, le figure 7 e 8 mostrano le curve di previsione per l'idrogenofosfato di calcio diidrato nell'arco di due anni rispettivamente a Parigi (Francia) e a Giacarta (Indonesia). Come previsto, il comportamento del campione differisce notevolmente tra le due città. La disidratazione avviene più rapidamente a Giacarta a causa delle temperature più elevate rispetto a quelle di Parigi.
Conclusione
La combinazione di termogravimetria e cinetica Neo è un potente strumento per ottenere informazioni iniziali sulla stabilità di una sostanza a specifiche temperature di conservazione.
Può essere utilizzata per lo screening di API (principi attivi farmaceutici) ed eccipienti durante lo sviluppo di un nuovo prodotto farmaceutico, al fine di realizzare una preselectione per studi di stabilità di lunga durata.