Introduction
The stability of APIs (active pharmaceutical ingredients) and excipients is directly related to their storage conditions: Storage at an improper temperature (too warm or too cold) may affect their efficacy, safety and shelf life. The tests for pharmaceutical storage stability described in the WHO (World Health Organization) and ICH (International Council for Harmonisation of Technical Requirements for Human Use) guidelines require a minimum of 6 months to complete. [1, 2]
The initial information about the stability of a substance under specific temperature conditions can be obtained within the first several hours. To this end, the kinetics of the substance’s degradation process (thermal Decomposition reactionA decomposition reaction is a thermally induced reaction of a chemical compound forming solid and/or gaseous products. decomposition, desolvation, dehydration) are evaluated and used to determine its behavior during long-time isotherms. This allows for the initial sorting of APIs/excipients to be carried out rapidly.
In the following, the kinetics of the dehydration reaction for calcium hydrogen phosphate dihydrate, CaHPO4·2H2O (also called DCP), are established. To do this, thermogravimetric measurements carried out at different heating rates are used to evaluate the reaction kinetics by means of the NETZSCH Kinetics Neo software.
Measurement Conditions
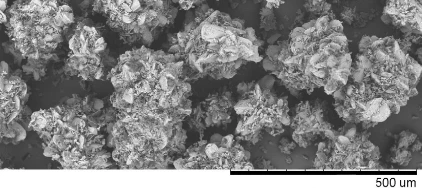
DCP is a filler which is Adiabatic temperature riseThe adiabatic temperature rise (delta Tad) is the observed temperature rise (delta Tobs) of a self-heating decomposition reaction under adiabatic conditions in consideration of the PHI-factor.commonly used for tabletting. The substance used for the measurements was kindly provided by JRS Pharma (commercial name: Emcompress®). The experimental conditions are summarized in table 1.
Table 1: Test conditions
Device | TG 209 F1 Nevio coupled to the FT-IR spectrometer from Bruker Optics (PERSEUS® coupling) | TG 209 F1 Nevio |
|---|---|---|
| Sample | DCP Emcompress® (JRS Pharma) | |
| Sample mass | 3.71 mg | 3.71 mg to 4.30 mg |
| Crucible | Closed Concavus® (Al) with pierced lid | |
| Temperature program | 30°C to 300°C | |
| Heating rate | 10 K/min | 1 K/min to 20 K/min |
Measurement Results
TGA-FT-IR Measurement on DCP
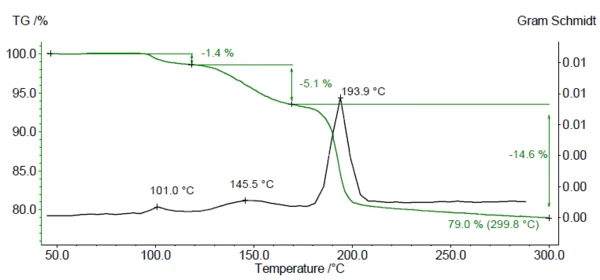
Figure 1 displays the mass-loss curve (green) and the Gram Schmidt plot (black) resulting from the TGA-FTIR measurement on DCP. The Gram Schmidt curve indicates the temperature ranges in which released gases were detected. Three mass-loss steps are visible between room temperature and 300°C, corresponding to three maxima in the Gram-Schmidt plot. The measured residual mass of 79% corresponds to the theoretical residual mass after the loss of 2 H2O from DCP.
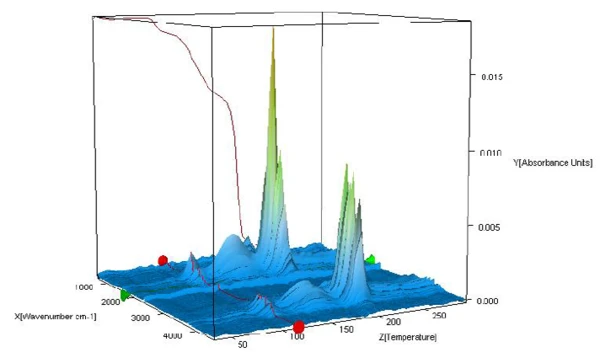
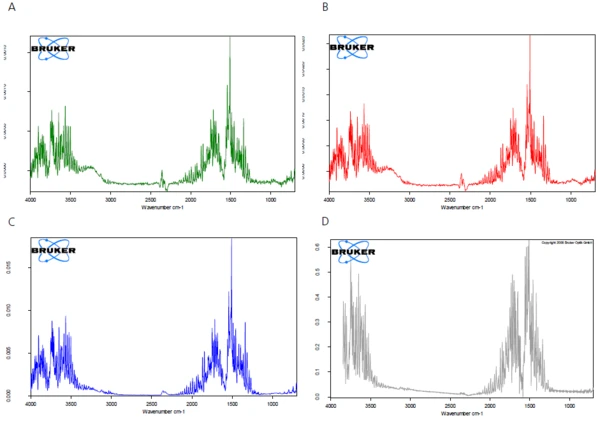
The FT-IR spectra of the products released during heating are analyzed to check whether only water or also further components are released in this temperature range. Figure 2 displays the FT-IR spectra of the substances released during the measurement as a threedimensional view. Extraction of the spectra at different temperatures shows that the detected mass-loss steps are due only to the evolvement of water (see figures 3A, 3B and 3C, FT-IR spectra of the substances released at 110°C, 159°C and 205°C as well as 3D, water comparison spectrum from the EPA-NIST library).
It is known from literature [4] that the surface water and structural water begin to leave the crystal structure around 80°C, at which point an amorphous phase starts to form. The amount of substance in the amorphous phase increases during Decomposition reactionA decomposition reaction is a thermally induced reaction of a chemical compound forming solid and/or gaseous products. decomposition up to 200-220°C and varies with the heating rate.
Kinetics Analysis of the Dehydration Process
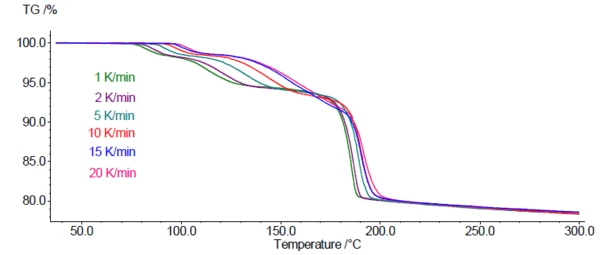
Figure 4 depicts the TGA measurement curves for DCP at 6 different heating rates between 1 and 20 K/min. As expected for this kinetic process, the mass-loss steps are shifted to higher temperatures with increasing heating rates.
This dependence of the mass-loss steps on the heating rate allows for the use of the TGA-curves for a kinetics analysis of the dehydration. For this, the Kinetics Neo software (by NETZSCH-Gerätebau GmbH) was used. It can assign each individual step different reaction types with kinetic parameters of their own, such as activation energy, order of reaction, and pre-exponential factor. Based on the results, Kinetics Neo is able to simulate the reaction(s) for user-specified temperature programs, e.g., long-time isotherms at a specific temperature.
The following observations help determine the number and type of the kinetics steps.
- The presence of three mass-loss steps suggests that the process takes plave over the course of at least three steps.
- The fact that the curves at a low heating rate interset the curves at a high heating rate (see the temperature range of 150°C-190°C) is an indication that a reaction step should be described by a competitive or parallel reaction model.
- After the third mass-loss step, the mass continues to decrease; this may be described by an additional step in the kinetics model.
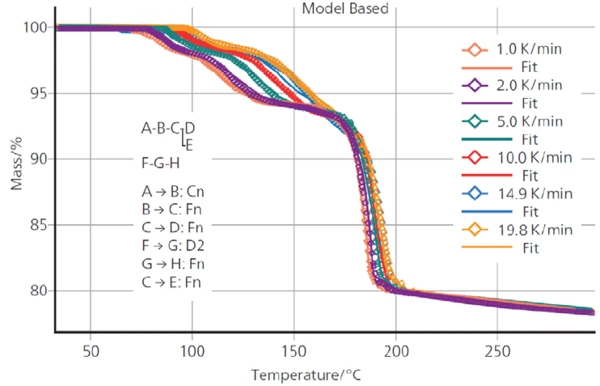
Ultimately, the following model was found to best describe the process:

- The reaction step A → B describes the first mass-loss step of the TGA curve and comes from the release of surface water.
The reaction steps
B → C → D
C → E
may correspond to the steps described by Rabatin et al. [3]:
CaHPO4 · 2H2O → CaHPO4 · xH2O + (2-x)H2O(I)
H2O(I) → H2O(g)
leading to the formation of different stoichiometric amounts of water with CaHPO4 · H2O [product D] and CaHPO4 · yH2O [product E].
Additionally, the formation of the amorphous phase has started, which depends on the heating rate. The lower the heating rate, the longer the duration of the amorphous phase. Different durations of the amorphous phase resulting from different heating rates may be responsible for different TGA values after the second Decomposition reactionA decomposition reaction is a thermally induced reaction of a chemical compound forming solid and/or gaseous products. decomposition step at 180°C and responsible for the Decomposition reactionA decomposition reaction is a thermally induced reaction of a chemical compound forming solid and/or gaseous products. decomposition in parallel ways. In Kinetics Neo, the products D and E are described with with F (F = D + E). - The detection temperature of the third mass-loss step is consistent with the DTA-measurement described by Rabatin et al. [3], in which a peak was detected at 195°C. The authors associated this peak with following mechanism: CaHPO4 · xH2O → CaHPO4 (amorphous) + xH2O
This, in turn, correlated with the step F → G from Kinetics Neo. - The reaction step G → H describes the continuous mass decrease above 200°C.
Figure 5 shows the good fit between the measured TGA curves and those calculated by Kinetics Neo using the described kinetics model. The coefficient of correlation between the measured and calculated curves amounts to 0.999.
The parameters of each reaction step calculated by Kinetics Neo are summarized in table 2.
Table 2: Kinetic parameters of the reaction steps
| Reaction step | A → B | B → C | C → D | D → E | F (D+E) → G | G → H |
| Reaction type | nth order with autocatalysis | nth order | nth order | nth order | diffusion | nth order |
| Activation energy [kJ·mol-1] | 144.8 | 104.2 | 111.3 | 50.7 | 611.9 | 19.9 |
| Log (pre-exponential factor) | 17.9 | 11.5 | 11.9 | 0.5 | 67.2 | 4.1 |
| Reaction order | 1.59 | 0.43 | 0.91 | 0.01 | - | 3.17 |
| Contribution | 0.063 | 0.067 | 0.150 | 0.235 | 0.495 | 0.182 |
From Kinetics Evaluation to Predictions of the Sample Behavior
Knowledge of the reaction kinetics allows for simulating the dehydration process for any selected temperature program, including long-time isotherms.
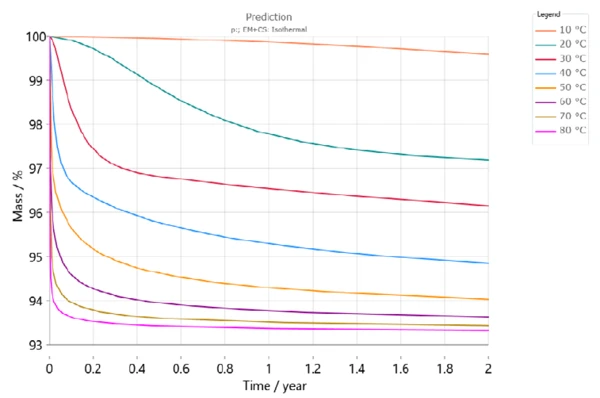
Figure 6 shows the dehydration of DCP over the course of two years for different storage temperatures. According to this simulation, there will be a mass loss of more than 3% after 6 months at a storage temperature of 30°C (red curve). At 50°C, however, the mass loss will be already more than 5% within the same period (light orange).
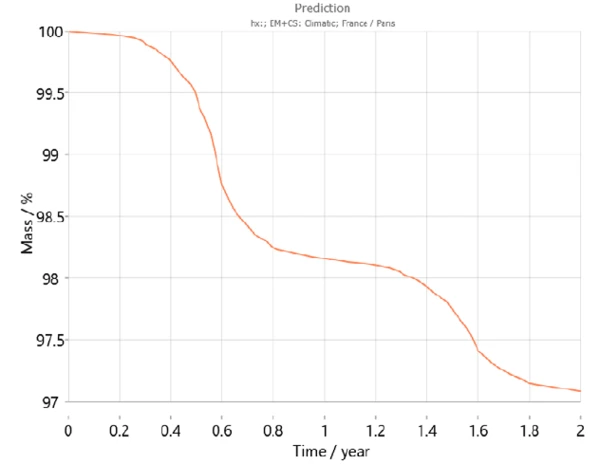
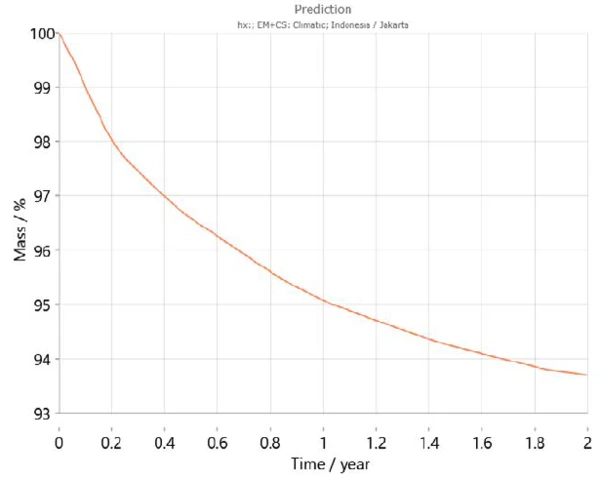
Additionally, Kinetics Neo contains a climatic map taking into account the average temperature patterns over the course of recent years for the different regions of the world including the temperature variations during the year. Using this information, Kinetics Neo is able to adapt its prediction of sample behavior for a given country. For example, figures 7 and 8 show the prediction curves for calcium hydrogen phosphate dihydrate over two years in Paris (France) and Jakarta (Indonesia), respectively. As expected, the behavior of the sample differs greatly between the two cities. Dehydration runs faster in Jakarta because of the higher temperatures compared to those in Paris.
Conclusion
The combination of thermogravimetry and Kinetics Neo is a powerful tool for obtaining initial information about the stability of a substance for specific storage temperatures.
It may be used for the screening of APIs (active pharmaceutical ingredients) and excipients during the development of a new pharmaceutical product in order to make a pre-selection for stability studies of longer durations.