Introduction
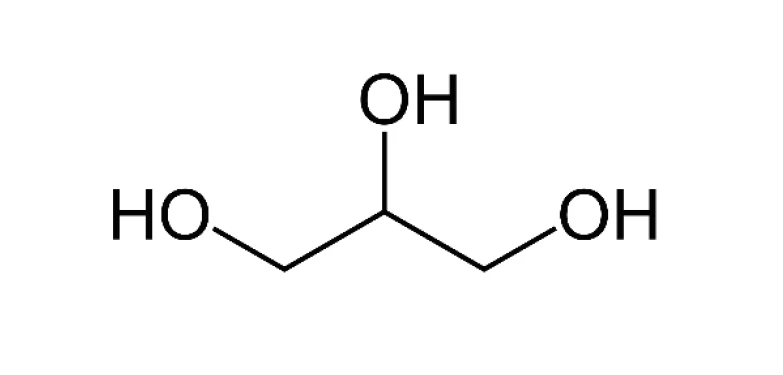
Glycerol is a simple triol compound which was first isolated in 1779 by Carl Wilhelm Scheele. From this time onward, a great success story ensued. Nowadays, it is used in cosmetics, medicines, shoe polish, anti-freeze, animal feed, shisha tobacco and food. There are very few raw materials as versatile as glycerol. Even very recent research activities from the field of lithium-ion batteries found glycerol to be an important binder additive which facilitates lithium ion diffusion at the low-resistance graphite anode interface and enhances high-rate capability [1].
Across the widely varied application fields, the question regarding the Thermal StabilityA material is thermally stable if it does not decompose under the influence of temperature. One way to determine the thermal stability of a substance is to use a TGA (thermogravimetric analyzer). thermal stability of glycerol and the gases that may be produced during a temperature treatment always arises.
Experimental
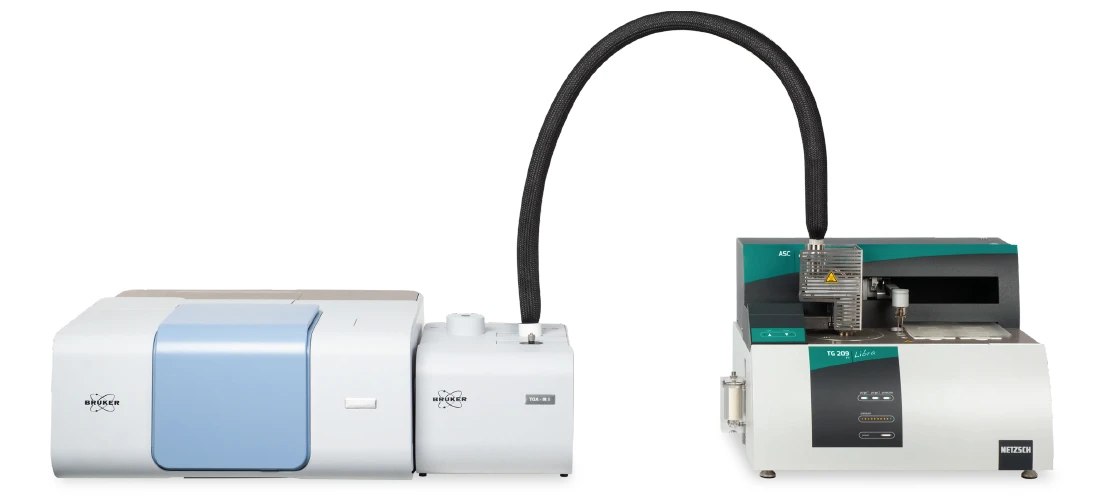
Answering this is an easy task for the TGA-FT-IR coupling system. The current configuration enables a significantly increased transfer temperature of the coupling interface to 370°C with the TGA II gas cell on the Bruker INVENIO FT-IR spectrometer, the coupling adapter on the thermobalance TG 209 F1 Libra® and the transfer line with a metal capillary inside (figure 1).
Measurement Results
The heating of 15 mg of glycerol in an open Al2O3 crucible in a pure nitrogen atmosphere at 10 K/min results in complete VaporizationThe Vaporization of an element or compound is a phase transition from the liquid phase to vapor. There exists two types of vaporization: evaporation and boiling.vaporization by 300°C. The extrapolated onset was detected at 199°C. The peak in the mass-loss rate (DTG, black) was found at 239°C; see figure 2. This corresponds well with the peak in the Gram-Schmidt curve. The Gram-Schmidt curve shows the total IR absorbance intensity and proves the release of IR active gases. This plot already shows the perfect transfer of the gases released to the gas analyzer without tailing or delay.
For detailed insight into the process occurring during VaporizationThe Vaporization of an element or compound is a phase transition from the liquid phase to vapor. There exists two types of vaporization: evaporation and boiling.vaporization, it is necessary to analyze the FT-IR data obtained.
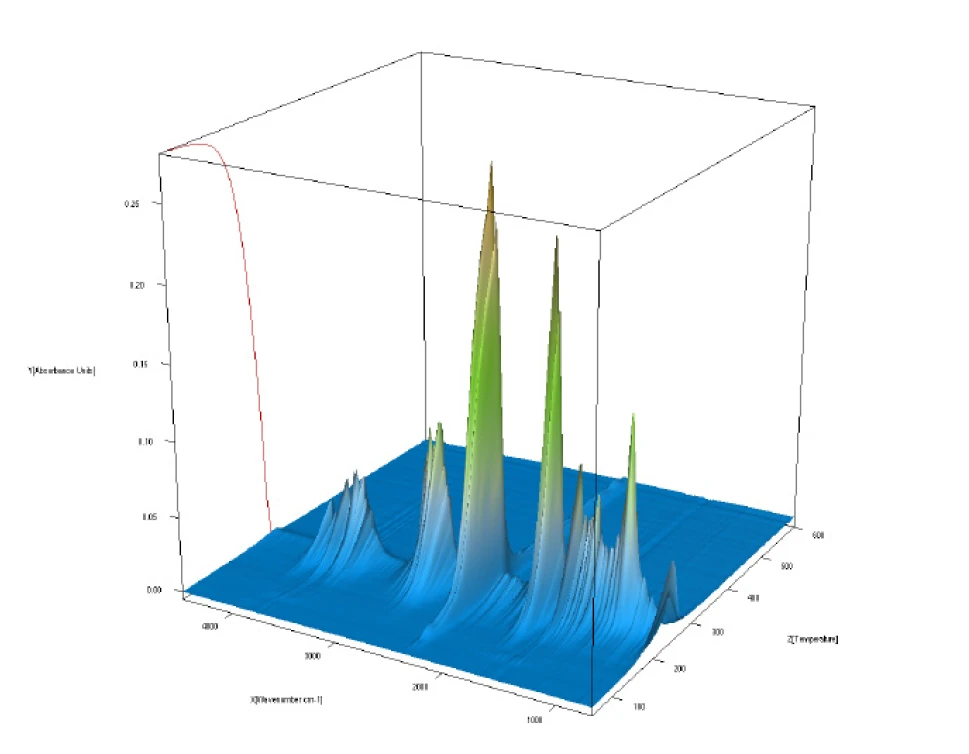
Figure 3 depicts all of the FT-IR data in a temperature-scaled 3-D plot. This plot also shows the good correlation of the FT-IR intensity increase with mass loss. Comparison of the measured FT-IR spectra at each temperature to the NIST vapor phase spectra library allows for identification of the gases released.
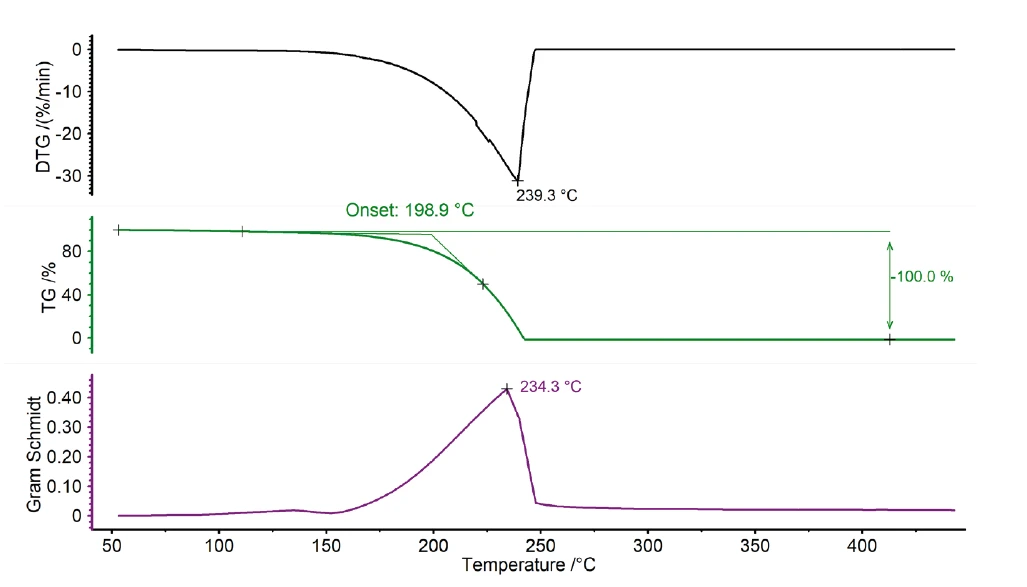
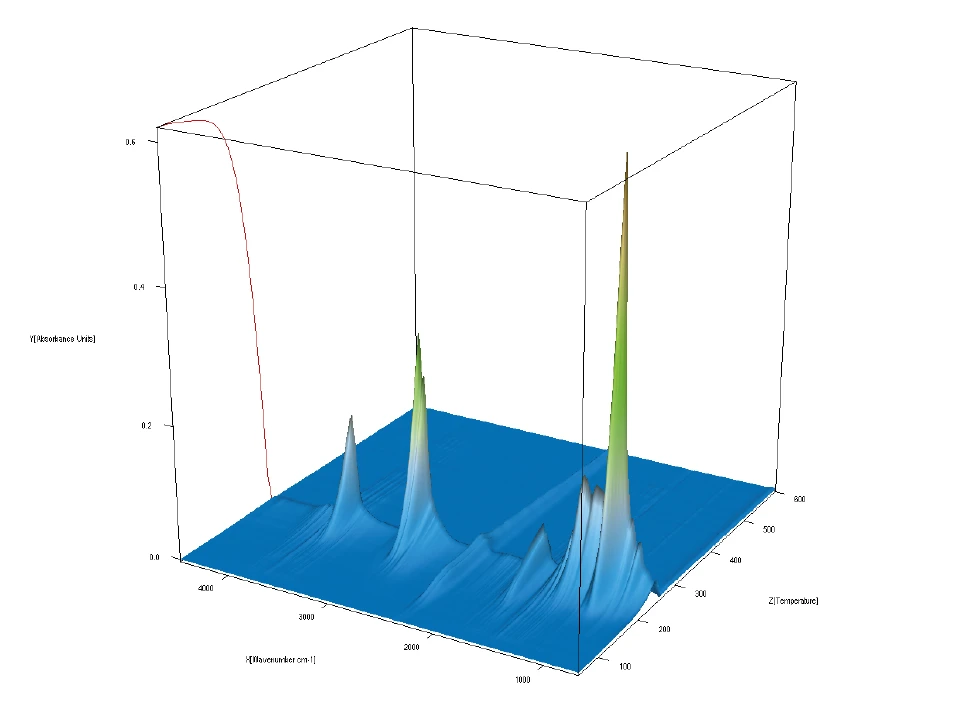
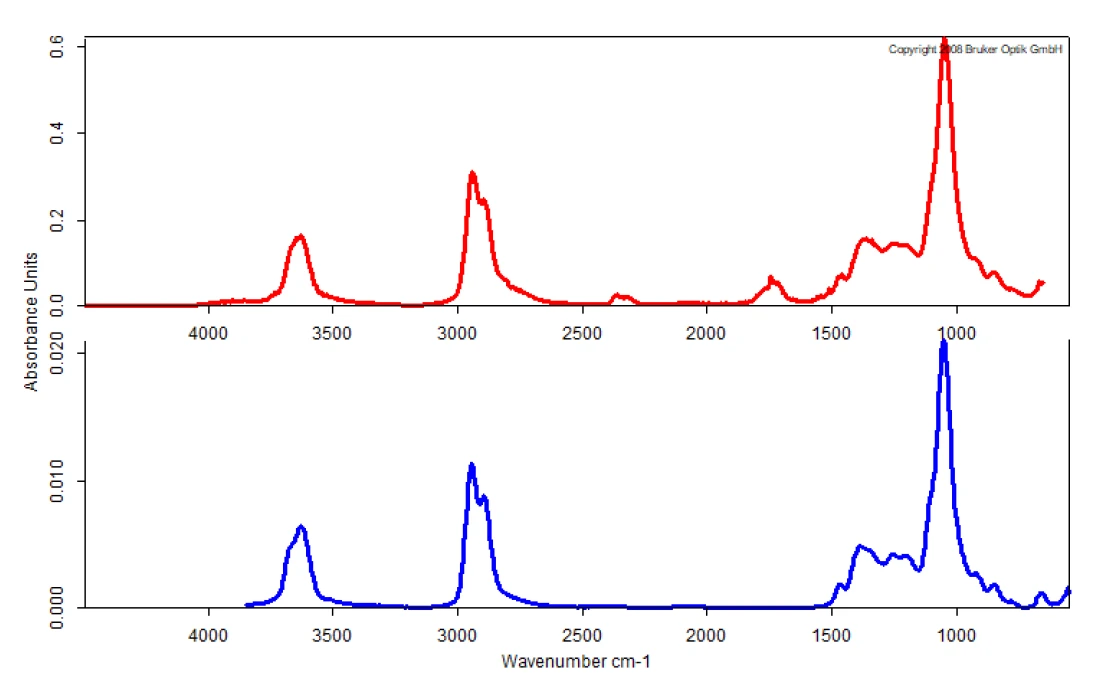
Figure 4 shows a good correlation of the measured spectrum at 234°C in a nitrogen atmosphere with the library spectrum of glycerol. This proves that glycerol mainly undergoes an evaporation process under the exclusion of oxygen, since it volatilizes as a complete molecule.
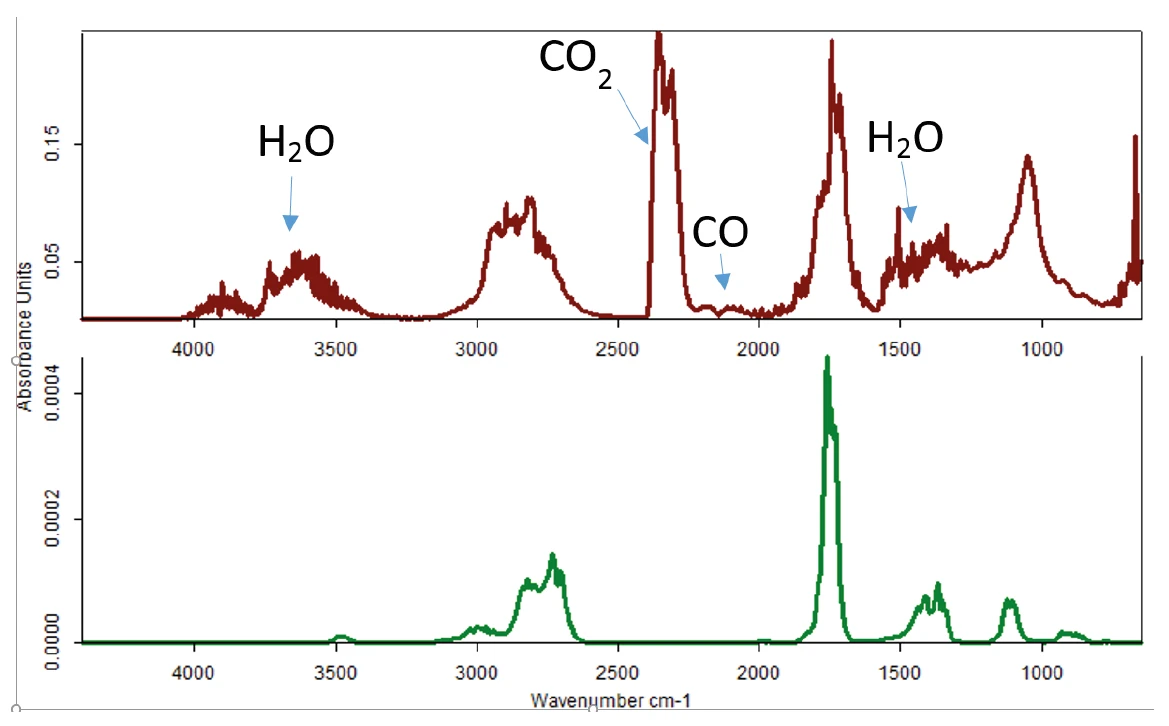
The experiment was repeated under oxidizing conditions. The resulting FT-IR data can be seen in figure 5. Here, a completely different FT-IR pattern was detected.
The comparison to the spectra library showed high similarity to water, carbon dioxide, carbon monoxide, acetaldehyde and, to a minor extent, pure glycerol (figure 6). In this case, glycerol decomposes into different products, even harmful ones such as acetaldehyde and CO.
This behavior clearly reveals that the gas atmosphere used has significant influence on the Thermal StabilityA material is thermally stable if it does not decompose under the influence of temperature. One way to determine the thermal stability of a substance is to use a TGA (thermogravimetric analyzer). thermal stability of glycerol.
Summary
In conclusion, the NETZSCH TG 209 F1 Libra® to BRUKER FT-IR INVENIO coupling with an interface temperature of 370°C enables a fast and complete transfer of the gases evolved to the spectrometer and their identification. With this system, it is possible to distinguish between evaporation and Decomposition reactionA decomposition reaction is a thermally induced reaction of a chemical compound forming solid and/or gaseous products. decomposition of high-boiling organics, as in the present example using glycerol.