Introduzione
Il trattamento termico di diversi materiali può portare al rilascio di ammoniaca, che ha un odore aggressivo e può attaccare il sistema bronchiale. Il rilascio di ammoniaca può essere causato da una serie di processi diversi. Si va dalla Reazione di decomposizioneUna reazione di decomposizione è una reazione termicamente indotta di un composto chimico che forma prodotti solidi e/o gassosi. decomposizione termica dei sali ai fumi di combustione del tabacco, dalla PirolisiLa pirolisi è la decomposizione termica di composti organici in atmosfera inerte.pirolisi di polimeri come le poliammidi (PA) alla produzione di schiume plastiche che richiedono agenti espandenti. Un prodotto comunemente noto di quest'ultima categoria sono i tappetini da yoga. Il rilascio di ammoniaca può creare polveri sottili reagendo con l'acido solforico e l'acido nitrico quando si formano i sali. Nell'ambiente, il rilascio di ammoniaca può portare all'acidificazione del suolo. Una delle principali fonti di ammoniaca nell'ambiente è l'agricoltura, in particolare la concimazione con fertilizzanti minerali contenenti letame e azoto.
Per questo motivo, la quantificazione dell'ammoniaca rilasciata è stata importante in molte applicazioni. Il rilascio di ammoniaca in funzione della temperatura può essere facilmente rilevato mediante accoppiamento TGA-FT-IR. Per quantificare la porzione di ammoniaca rilasciata, è necessaria una curva di calibratazione con una concentrazione nota di ammoniaca. Un composto adatto a questo scopo è il bicarbonato di ammonio, perché rilascia ammoniaca in un rapporto stechiometrico oltre al rilascio di acqua e anidride carbonica; si veda l'equazione (1). Vengono prodotti solo composti gassosi:
(1) NH4HCO3->NH3 + H2O+ CO2
Come generare la Curva di Calibratazione
Per effettuare questo studio è stato utilizzato un NETZSCH PERSEUS® TG 209 F1 Libra® . Il riscaldamento del bicarbonato di ammonio ha portato alla completa Reazione di decomposizioneUna reazione di decomposizione è una reazione termicamente indotta di un composto chimico che forma prodotti solidi e/o gassosi. decomposizione entro 200°C, con un picco nel tasso di perdita di massa a 127°C (in base alle condizioni di misurazione riportate nella tabella 1).
Tabella 1: Condizioni di misurazione per la generazione della curva di calibratificazione
| Parametro | NH4HCO3 | |||
| Programma di temperatura | RT - 200°C, 5 K/min | |||
| Velocità di flusso | 40 ml/min | |||
| Supporto del campione | Portacampioni standard | |||
| Atmosfera di gas | Azoto | |||
| Crogiolo | Al2O3 (85 μl) aperto | |||
| Massa del campione | 5.31 mg | 10.16 mg | 15.01 mg | 20.50 mg |
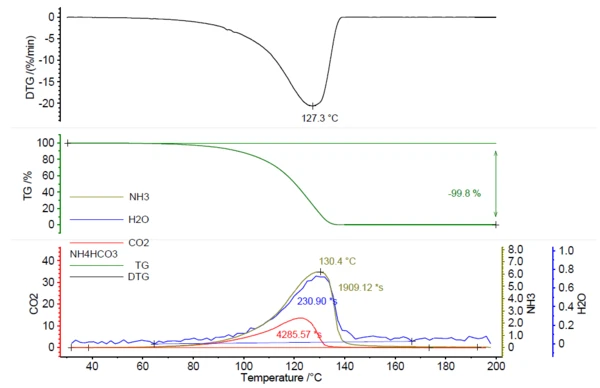
In correlazione con la perdita di massa, è stato rilevato il rilascio di gas attivi all'IR; si veda la figura 1.
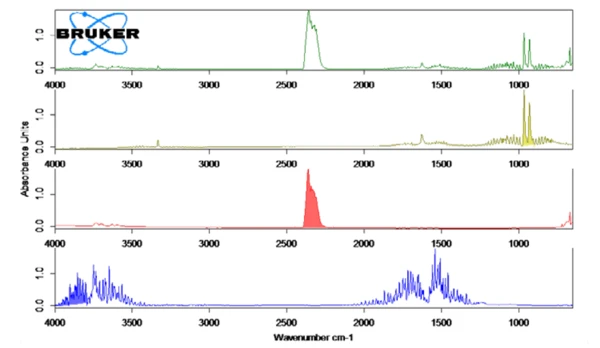
La figura 2 mostra lo spettro FT-IR misurato a 130°C (verde) in correlazione con gli spettri library di ammoniaca (oliva), acqua (blu) e anidride carbonica (rosso). Il rilascio di questi composti in funzione della temperatura è stato tracciato come tracce nella figura 1. Queste tracce sono state create dall'integrazione del rilascio di ammoniaca, acqua (blu) e anidride carbonica (rosso). Queste tracce sono state create integrando le regioni colorate (vedi figura 2) degli spettri FT-IR di ciascun composto per l'intero intervallo di temperatura. Queste regioni degli spettri FT-IR erano separate per NH3 (898 cm-1 - 981 cm-1),CO2 (2200 cm-1 - 2450 cm-1) eH2O(3793 cm-1 - 4001 cm-1) e non vi era sovrapposizione con le regioni di altri composti.
La tabella 2 mostra le quantità stechiometriche dei gas rilasciati in relazione alla massa del campione di bicarbonato di ammonio.
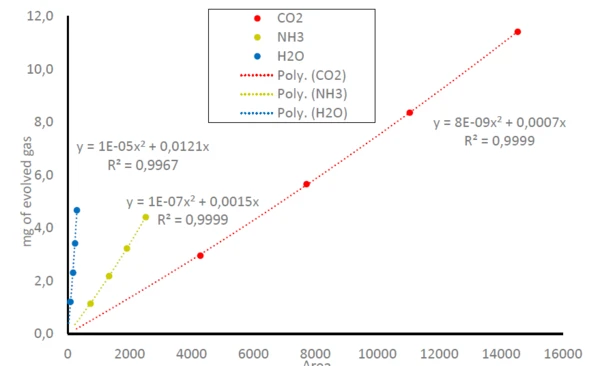
Di conseguenza, le aree sotto le tracce di NH3,CO2 eH2Onella figura 1 possono essere messe in relazione con la quantità di gas rilasciati; confrontare l'equazione (1). Questo porta a curve di calibratificazione per NH3,CO2 eH2Oin cui l'area rilevata sotto le tracce è correlata alla quantità di gas rilasciato; si veda la figura 3. Poiché l'FT-IR ha solo un intervallo lineare di small, si ottengono equazioni polinomiali per tutte e tre le molecole gassose con coefficienti di determinazione (R2) molto vicini a 1. In questo studio, ogni massa di campione è stata misurata una sola volta. Misure ripetute o un maggior numero di punti dati porterebbero a un'accuratezza ancora maggiore nella linea di tendenza.
Tabella 2: Massa del campione e quantità stechiometriche di gas evoluto risultante
| m (NH4HCO3) [mg] | m (CO2) [mg] | m (NH3) [mg] | m (H2O) [mg] |
| 5.31 | 2.96 | 1.14 | 1.21 |
| 10.16 | 5.66 | 2.19 | 2.31 |
| 15.01 | 8.36 | 3.23 | 3.42 |
| 20.50 | 11.42 | 4.41 | 4.67 |
Come verificare l'accuratezza della Curva di Calibratazione
L'accuratezza della curva di calibratificazione è stata verificata con un'altra misurazione su NH4HCO3 con una massa di campione definita di 15,22 mg. Le quantità teoriche di NH3,CO2 eH2Osono state confrontate con i valori calcolati di NH3,CO2 eH2Outilizzando la curva di calibratificazione. Si sono così ottenuti valori di errore compresi tra lo 0,8% per l'NH3 e il 4,9% per l'H2O; si veda la tabella 3.
Studio di un agente soffiante - Messa in pratica della teoria
Nella fase successiva, le curve di calibratificazione ottenute e verificate possono essere utilizzate per quantificare il rilascio di quantità sconosciute dei gas calibratificati.
L'azodicarbonammide è utilizzata come agente espandente per produrre schiume polimeriche (per la struttura, vedere la figura 4). È impiegata nella produzione di schiume di PVC e di schiume EVA-PE, dove forma bolle al momento della Reazione di decomposizioneUna reazione di decomposizione è una reazione termicamente indotta di un composto chimico che forma prodotti solidi e/o gassosi. decomposizione alle temperature di lavorazione, rilasciando N2, CO,CO2 e NH3. La schiuma di vinile è facilmente comprimibile e presenta un recupero elevato e rapido, per cui viene spesso definita "elastica". Inoltre, si attacca alle superfici lisce. Per questo motivo, viene utilizzata per sottotappeti, tappeti e tappetini per lo yoga.
I polimeri per i quali è stato utilizzato questo agente espandente non possono entrare in contatto con l'acqua. L'NH3 e l'acqua possono formare NH4OHe corrodere l'ambiente circostante. Per questo motivo, la quantificazione dell'ammoniaca prodotta da questo agente espandente è di grande interesse.
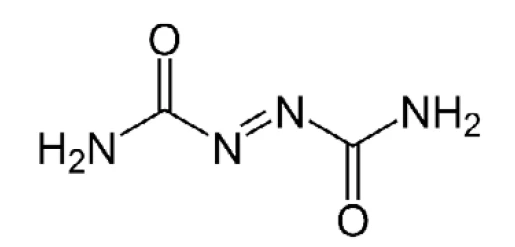
Tabella 3: Determinazione dell'errore, confronto tra quantità teoriche e calcolate
Teorico (mg) | Calcolato (mg) | Errore (%) | |
| m (NH4HCO3) | 15.22 | ||
| m (NH3) | 3.28 | 3.30 | 0.801 |
| m (CO2) | 8.48 | 8.76 | 3.28 |
| m (H2O) | 3.47 | 3.31 | 4.86 |
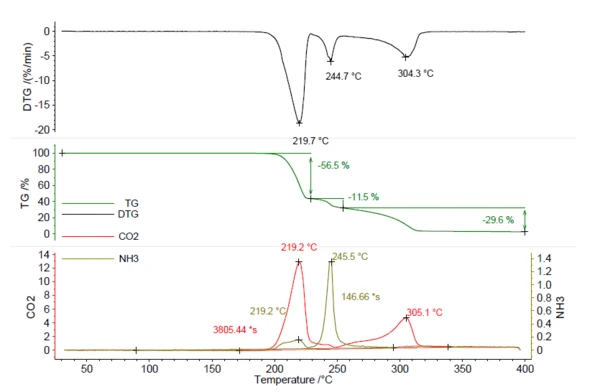
Un campione di 5,25 mg di azodicarbonammide è stato riscaldato a 400°C a 5 K/min in atmosfera di azoto. Il termogramma risultante è riportato in figura 5. In totale, sono stati osservati tre passaggi di perdita di massa del 56,5%, 11,5% e 29,6% con picchi nella curva DTG a 219°C, 245°C e 304°C. Le tracce diCO2 e NH3 sono state create nello stesso modo di quelle di NH4HCO3 nella figura 1 e sono rappresentate in rosso e oliva. Ciò dimostra che sia laCO2 che l'NH3 sono stati rilasciati durante le varie fasi di perdita di massa e non possono essere quantificati dalle sole fasi TGA. Per la quantificazione di questo composto sono necessari i dati dell'analisi dei gas evoluti. Il calcolo dell'ammoniaca rilasciata utilizzando la curva di calibratificazione ha dato come risultato 0,22 mg di NH3 (4%). Anche la quantità diCO2 rilasciata può essere calcolata allo stesso modo ed è risultata pari a 2,78 mg (53%). Questa conoscenza è preziosa per il processo di produzione, al fine di assicurarsi che l'intera quantità di agente espandente venga rilasciata durante la schiumatura. Se nel prodotto rimangono tracce di small, sono necessarie temperature superiori a 219°C per avviare un ulteriore rilascio.
Conclusione
La combinazione di termogravimetria e spettroscopia a infrarossi è un metodo adatto a rilevare il rilascio di gas permanenti, ad esempio acqua, anidride carbonica e ammoniaca. Non è solo l'identificazione, ma anche la quantificazione che può essere di interesse in questo caso. A tal fine, è necessario generare una curva di calibratificazione con un materiale noto. In questo esempio, il bicarbonato di ammonio soddisfa perfettamente questi requisiti. Le curve di calibratificazione possono essere create contemporaneamente perH2O,CO2 e NH3 decomponendo tre diverse porzioni di NH4HCO3. Le deviazioni da esporre sono state determinate da una quinta misurazione. Con questa preparazione è stato possibile identificare e quantificare quantità sconosciute di NH3 eCO2 provenienti dall'agente espandente azodicarbonamide utilizzato per le schiume polimeriche.