Introduction
The thermal treatment of different materials can lead to the release of ammonia, which has an aggressive smell and may attack the bronchial system. Ammonia release can be caused by a variety of different processes. These range from the thermal decompositions of salts to fumes from burning tobacco, and from the PyrolysisPyrolysis is the thermal decomposition of organic compounds in an inert atmosphere.pyrolysis of polymers such as polyamides (PA) and manufacture of plastic foams that require blowing agents. A commonly known product of the latter category are yoga mats. The release of ammonia can create fine dust by reacting with sulfuric acid and nitric acid when salts have formed. In the environment, the release of ammonia can lead to the acidification of soil. One of the main sources of ammonia in the environment is agriculture, especially fertilization with dung- and nitrogen-containing mineral fertilizer.
For this reason, the quantification of released ammonia has been important in many applications. The temperature-dependent release of ammonia can be easily detected via TGA-FT-IR coupling. To quantify the ammonia portion released, a calibration curve with a known concentration of ammonia is necessary. A suitable compound for this is ammonium bicarbonate, because it releases ammonia in a stoichiometric ratio in addition to the release of water and carbon dioxide; see equation (1). Only gaseous compounds are produced:
(1) NH4HCO3-> NH3 + H2O + CO2
How to Generate the Calibration Curve
A NETZSCH PERSEUS® TG 209 F1 Libra® was used to perform this study. The heating of ammonium bicarbonate resulted in complete Decomposition reactionA decomposition reaction is a thermally induced reaction of a chemical compound forming solid and/or gaseous products. decomposition by 200°C, with a peak in the mass-loss rate at 127°C (based on the measurement conditions in table 1).
Table 1: Measurement conditions for generating the calibration curve
| Parameter | NH4HCO3 | |||
| Temperature program | RT – 200°C, 5 K/min | |||
| Flow rate | 40 ml/min | |||
| Sample holder | Standard sample carrier | |||
| Gas atmosphere | Nitrogen | |||
| Crucible | Al2O3 (85 μl) open | |||
| Sample mass | 5.31 mg | 10.16 mg | 15.01 mg | 20.50 mg |
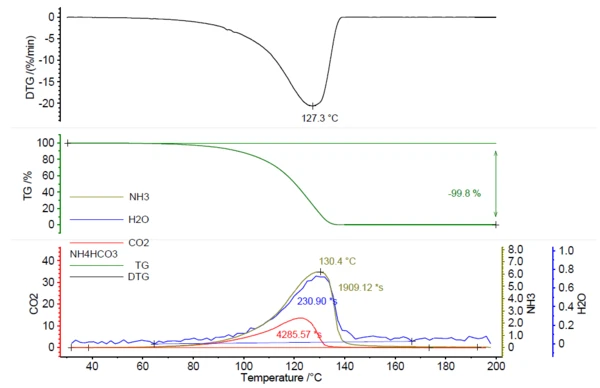
In correlation to the mass loss, the release of IR active gases was detected; see figure 1.
Figure 2 shows the measured FT-IR spectrum at 130°C (green) in correlation with the library spectra of ammonia (olive), water (blue) and carbon dioxide (red). The temperature-dependent release of these compounds was plotted as traces in figure 1. These traces were created by integration of the colored regions (see figure 2) of the FT-IR spectra for each compound over the entire temperature range. These regions of the FT-IR spectra were separate for NH3 (898 cm-1 – 981 cm-1), CO2 (2200 cm-1 – 2450 cm-1) and H2O (3793 cm-1 – 4001 cm-1) and there was no overlapping with regions from other compounds.
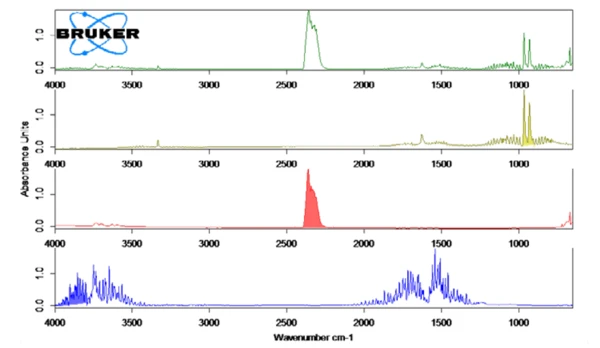
Table 2 shows the stoichiometrically calculated amounts of the gases released in relation to the sample mass of ammonium bicarbonate.
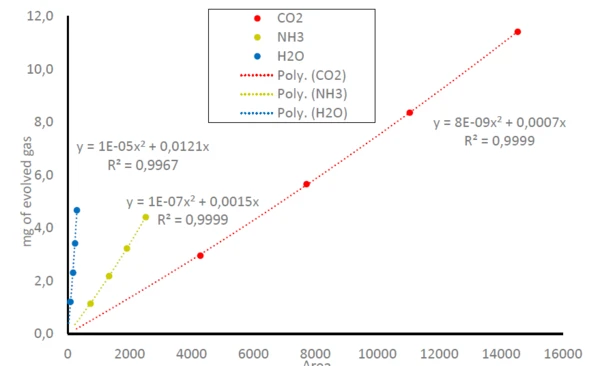
Consequently, the areas below the traces of NH3, CO2 and H2O in figure 1 can be related to the amount of the gases released; compare equation (1). This leads to calibration curves for NH3, CO2 and H2O where the detected area below the traces is related to the amount of released gas; see figure 3. As the FT-IR only has a small linear range, this results in polynomial equations for all three gaseous molecules with determination coefficients (R2) very close to 1. In this study, each sample mass was only measured once. Repeat measurements or more data points would lead to even higher accuracy in the trend line.
Table 2: Sample mass and resulting stoichiometric amounts of evolved gas
| m (NH4HCO3) [mg] | m (CO2) [mg] | m (NH3) [mg] | m (H2O) [mg] |
| 5.31 | 2.96 | 1.14 | 1.21 |
| 10.16 | 5.66 | 2.19 | 2.31 |
| 15.01 | 8.36 | 3.23 | 3.42 |
| 20.50 | 11.42 | 4.41 | 4.67 |
How to Test the Accuracy of the Calibration Curve
The accuracy of the calibration curve was checked with another measurement on NH4HCO3 with a defined sample mass of 15.22 mg. The theoretical amounts of NH3, CO2 and H2O were compared to the calculated values of NH3, CO2 and H2O using the calibration curve. This yielded error values between 0.8% for NH3 and 4.9% for H2O; see table 3.
Study of a Blowing Agent – Putting Theory into Practice
In the next step, the obtained and verified calibration curves could be used to quantify the release of unknown amounts of the calibrated gases.
Azodicarbonamide is used as a blowing agent to produce polymer foams (for structure, see figure 4). It is employed in the manufacture of PVC foams and EVA-PE foams, where it forms bubbles upon Decomposition reactionA decomposition reaction is a thermally induced reaction of a chemical compound forming solid and/or gaseous products. decomposition at processing temperatures as it releases N2, CO, CO2 and NH3. Vinyl foam is easily compressed and exhibits high and fast recovery, so it is often referred to as “springy”. It also sticks to smooth surfaces. For this reason, it is used for carpet underlay, floor mats and yoga mats.
Polymers for which this blowing agent was used are not allowed to come into contact with water. NH3 and water may form NH4OH and may corrode the surroundings. For this reason, the quantification of ammonia from this blowing agent is of great interest.
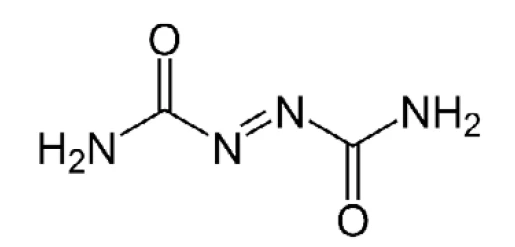
Table 3: Error determination, comparison of theoretical and calculated amounts
Theoretical (mg) | Calculated (mg) | Error (%) | |
| m (NH4HCO3) | 15.22 |
|
|
| m (NH3) | 3.28 | 3.30 | 0.801 |
| m (CO2) | 8.48 | 8.76 | 3.28 |
| m (H2O) | 3.47 | 3.31 | 4.86 |
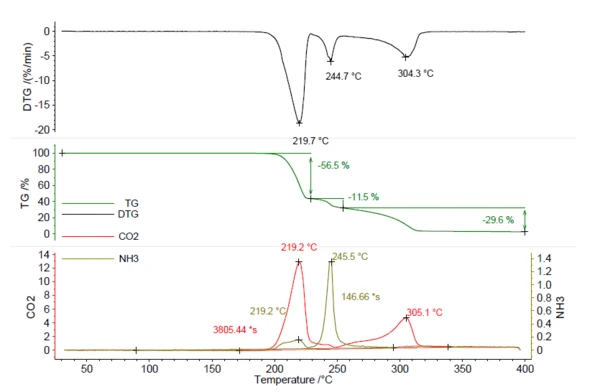
A sample of 5.25 mg azodicarbonamide was heated to 400°C at 5 K/min in a nitrogen atmosphere. The resulting thermogram can be seen in figure 5. In total, three massloss steps of 56.5%, 11.5% and 29.6% were observed with peaks in the DTG curve at 219°C, 245°C and 304°C. The traces of CO2 and NH3 were created in the same way as for NH4HCO3 in figure 1 and are depicted in red and olive. This shows that both CO2 and NH3 were released during the various mass-loss steps and cannot be quantified by the TGA steps alone. For quantification of this compound, data from evolved gas analysis are necessary. The calculation of released ammonia using the calibration curve resulted in 0.22 mg NH3 (4%). Also, the amount of released CO2 can be calculated in the same way and resulted in 2.78 mg (53%). This knowledge is valuable for the manufacturing process, in order to make sure that the entire amount of the blowing agent is released during foaming. If small traces remain in the product, temperatures of more than 219°C are necessary to initiate further release.
Conclusion
The combination of thermogravimetry and infrared spectroscopy is a suitable method for detecting the release of permanent gases, e.g., water, carbon dioxide and ammonia. It is not only the identification, but also the quantification that can be of interest here. To this end, a calibration curve must be generated with a known material. In this example, ammonium bicarbonate perfectly fulfills these requirements. Calibration curves can be simultaneously created for H2O, CO2 and NH3 by decomposing three different portions of NH4HCO3. The deviations to be exptected were determined by a fifth measurement. With this preparation, it was possible to identify and quantify unknown amounts of NH3 and CO2 from the blowing agent azodicarbonamide used for polymer foams.