Introduction
The lifetime of bitumen binder is closely linked to its viscoelastic characteristics. An easy way to determine these properties is to perform frequency sweep measurements with a rotational rheometer. The low-frequency range of such a test corresponds to long-time scales, while the higher range provides information about the sample´s behavior in short-time scales. In practice, it is often very challenging to carry out tests at very low frequencies because they require several days or weeks. Yet, it is important to predict asphalt binder or bitumen behavior during long periods.
How to Forecast the Long-Time Behavior of Asphalt Binders?
The answer is Time-Temperature Superposition, or TTS. This principle is based on the fact that a shift in temperature has the same impact on the viscoelastic properties as a shift in frequency or time. In other words, you can expand the frequency range of a measurement by performing tests in the same frequency range, but at different temperatures.
How to Use Time-Temperature Superposition
The objective is to expand the resulting curve of a frequency sweep to a broader frequency range. The method is easy:
- Measurement of frequency sweeps at different temperatures
- Creation of a master curve at a user-defined temperature. The sequence allowing for the creation of a master curve is integrated into the rSpace software1 .
Example for the Creation of a Master Curve for an Unmodified Asphalt Binder
Frequency sweeps were performed at different temperatures on an unmodified asphalt binder. Table 1 depicts the measurement conditions.
Linear Visco-Elastic Range
The Linear Viscoelastic Region (LVER)In the LVER, applied stresses are insufficient to cause structural breakdown (yielding) of the structure and hence important micro-structural properties are being measured.LVER is the amplitude range where StrainStrain describes a deformation of a material, which is loaded mechanically by an external force or stress. Rubber compounds show creep properties, if a static load is applied.strain and StressStress is defined as a level of force applied on a sample with a well-defined cross section. (Stress = force/area). Samples having a circular or rectangular cross section can be compressed or stretched. Elastic materials like rubber can be stretched up to 5 to 10 times their original length.stress are proportional. In the Linear Viscoelastic Region (LVER)In the LVER, applied stresses are insufficient to cause structural breakdown (yielding) of the structure and hence important micro-structural properties are being measured.LVER, the applied stresses (or strains) are insufficient to cause structural breakdown and hence microstructural properties are being measured.
Table 1: Measurement conditions
| Device | Kinexus DSR-III | |||||
|---|---|---|---|---|---|---|
| Geometry | Plate-plate, diameter: 8 mm | Plate-plate, diameter: 25 mm | ||||
| Gap | 2 mm | 1 mm | ||||
| Temperature | 5°C | 15°C | 25°C | 35°C | 45°C | 65°C |
| Shear amplitude | Determined to be in the Linear Viscoelastic Region (LVER)In the LVER, applied stresses are insufficient to cause structural breakdown (yielding) of the structure and hence important micro-structural properties are being measured.LVER | |||||
| Frequency | 0.01 to 402 Hz | |||||
1 The Kinexus Prime DSR software comprises both measuring and evaluation routines
2 Limited by the inertia of the device
Measurement Results
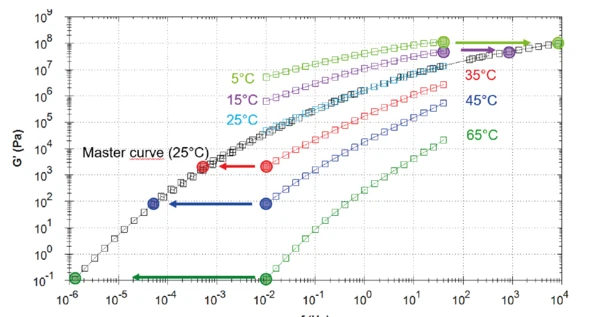
Figure 1 displays the elastic shear modulus (G') for the different temperatures tested (colourful curves). The higher the temperature, the lower the elastic shear modulus. This means that the material loses elasticity with increasing temperatures for a fixed frequency. At 0.01 Hz, the Elastic modulusThe complex modulus (elastic component), storage modulus, or G’, is the “real” part of the samples the overall complex modulus. This elastic component indicates the solid like, or in phase, response of the sample being measurement. elastic modulus increases from 1E-01 Pa at 65°C to almost 1E+07 Pa at 5°C, which is a difference of nearly 8 decades! This strong influence of temperature also explains the variation of asphalt properties depending on the seasons. In winter, the roads may be brittle with a tendency to crack, while they may get sticky in very hot summers. This is the reason different binder performance grades are designed, in order to suit different conditions according to country, state/region and usage (e.g. country road vs. highway).
The master curve at a reference temperature of 25°C (black curve) is obtained by shifting the points of the frequency sweeps at different temperatures (see example points in Figure 1). The higher the temperature, the more flexible the polymer chains and the faster the mobility of the molecules. Therefore, the RelaxationWhen a constant strain is applied to a rubber compound, the force necessary to maintain that strain is not constant but decreases with time; this behavior is known as stress relaxation. The process responsible for stress relaxation can be physical or chemical, and under normal conditions, both will occur at the same time. relaxation process, which takes place at lower temperature and lower frequency, is the same for higher temperature and higher frequency.1
The master curve (black curve) obtained at a reference temperature of 25°C stretches from 1E-06 to 1E04 Hz, thus an expansion of the frequency range of almost 7 decades! A frequency of 1E-06 Hz corresponds to more than 11 days. Such a duration for measuring only one point is not appropriate in practice. Therefore, TTS is absolutely necessary.
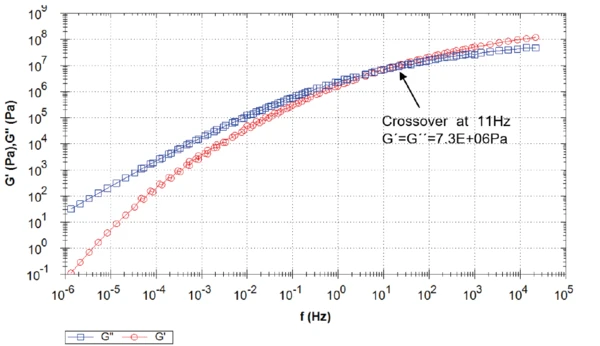
Figure 2 depicts the master curve at 25°C for the elastic and loss shear moduli. It shows a crossover of G´ and G" at 11 Hz, which means that the binder becomes elastically dominated for timescales shorter than 90 ms. The period time of the crossover frequency corresponds


1 More information about the dependance of the RelaxationWhen a constant strain is applied to a rubber compound, the force necessary to maintain that strain is not constant but decreases with time; this behavior is known as stress relaxation. The process responsible for stress relaxation can be physical or chemical, and under normal conditions, both will occur at the same time. relaxation time on temperature is explained in our application note AN 256 (Time-Temperature Superposition on Asphalt Binder)


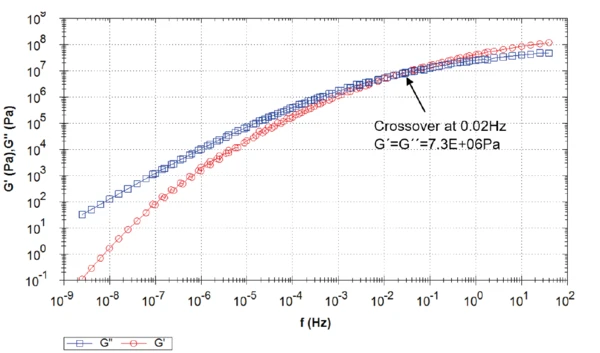
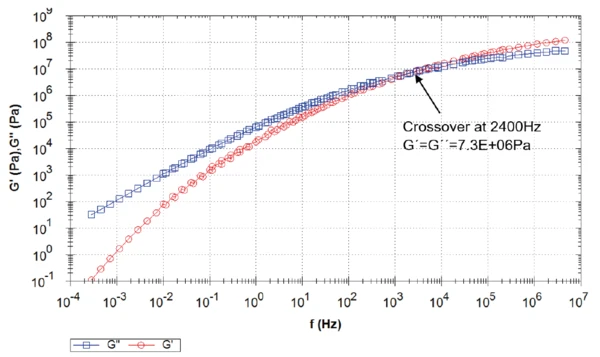
As a comparison, master curves were also created for reference temperatures of 5°C (Figure 3) and 45°C (Figure 4). The higher the temperature, the higher the crossover frequency. The time-temperature superposition assumes that temperature shifts the timescale of the RelaxationWhen a constant strain is applied to a rubber compound, the force necessary to maintain that strain is not constant but decreases with time; this behavior is known as stress relaxation. The process responsible for stress relaxation can be physical or chemical, and under normal conditions, both will occur at the same time. relaxation process, but has no influence on the process itself.
Conclusion
The Time-Temperature Superposition (TTS) is an easy way to predict the short and long-time behavior of your asphalt without performing time-consuming measurements.
The rSpace software calculates and displays the master curve for a user-defined temperature from frequency sweep measurements at different temperatures. This video explains how to generate a master curve in rSpace: