Wprowadzenie
Żywotność lepiszcza asfaltowego jest ściśle związana z jego właściwościami lepkosprężystymi. Łatwym sposobem określenia tych właściwości jest wykonanie pomiarów przemiatania częstotliwości za pomocą reometru rotacyjnego. Niski zakres częstotliwości takiego testu odpowiada długim skalom czasowym, podczas gdy wyższy zakres dostarcza informacji o zachowaniu próbki w krótkich skalach czasowych. W praktyce często bardzo trudno jest przeprowadzić testy przy bardzo niskich częstotliwościach, ponieważ wymagają one kilku dni lub tygodni. Ważne jest jednak, aby przewidzieć zachowanie lepiszcza asfaltowego lub asfaltu w długich okresach.
Jak prognozować długoterminowe zachowanie lepiszczy asfaltowych?
Odpowiedzią jest superpozycja czasowo-temperaturowa (TTS). Zasada ta opiera się na fakcie, że zmiana temperatury ma taki sam wpływ na właściwości lepkosprężyste, jak zmiana częstotliwości lub czasu. Innymi słowy, można rozszerzyć zakres częstotliwości pomiaru, wykonując testy w tym samym zakresie częstotliwości, ale w różnych temperaturach.
Jak korzystać z superpozycji czas-temperatura
Celem jest rozszerzenie krzywej wynikowej przemiatania częstotliwości na szerszy zakres częstotliwości. Metoda jest prosta:
- Pomiar przemiatania częstotliwości w różnych temperaturach
- Tworzenie krzywej wzorcowej w temperaturze zdefiniowanej przez użytkownika. Sekwencja umożliwiająca utworzenie krzywej wzorcowej jest zintegrowana z oprogramowaniem rSpace1.
Przykład tworzenia krzywej wzorcowej dla niemodyfikowanego lepiszcza asfaltowego
Pomiary częstotliwości przeprowadzono w różnych temperaturach na niemodyfikowanym lepiszczu asfaltowym. Tabela 1 przedstawia warunki pomiaru.
Liniowy zakres wiskoelastyczny
Liniowy obszar lepkosprężysty (LVER)W LVER przyłożone naprężenia są niewystarczające do spowodowania strukturalnego rozpadu (plastyczności) struktury, a zatem mierzone są ważne właściwości mikrostrukturalne.LVER to zakres amplitudy, w którym odkształcenie i naprężenie są proporcjonalne. W Liniowy obszar lepkosprężysty (LVER)W LVER przyłożone naprężenia są niewystarczające do spowodowania strukturalnego rozpadu (plastyczności) struktury, a zatem mierzone są ważne właściwości mikrostrukturalne.LVER przyłożone naprężenia (lub odkształcenia) są niewystarczające do spowodowania rozpadu strukturalnego, a zatem mierzone są właściwości mikrostrukturalne.
Tabela 1: Warunki pomiaru
| Urządzenie | Kinexus DSR-III | |||||
|---|---|---|---|---|---|---|
| Geometria | Płyta-płytka, średnica: 8 mm | Płyta-płytka, średnica: 25 mm | ||||
| Szczelina | 2 mm | 1 mm | ||||
| Temperatura | 5°C | 15°C | 25°C | 35°C | 45°C | 65°C |
| Amplituda ścinania | ||||||
| Częstotliwość | 0.01 do 402 Hz | |||||
1 Oprogramowanie Kinexus Prime DSR obejmuje zarówno procedury pomiarowe, jak i ewaluacyjne
2 Ograniczone bezwładnością urządzenia
Wyniki pomiarów
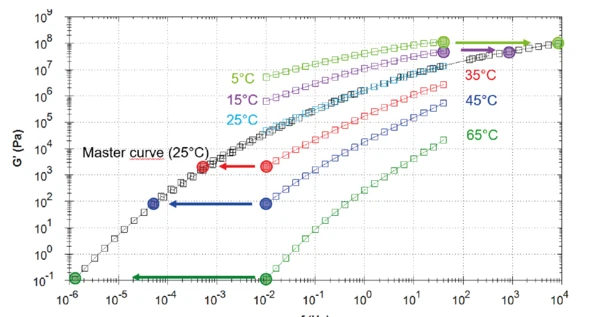
Rysunek 1 przedstawia moduł sprężystego ścinania (G') dla różnych testowanych temperatur (kolorowe krzywe). Im wyższa temperatura, tym niższy Moduł sprężystościModuł zespolony (składnik sprężysty), moduł magazynowania lub G', jest "rzeczywistą" częścią ogólnego modułu zespolonego próbki. Ten składnik sprężysty wskazuje na stałą lub fazową reakcję mierzonej próbki. moduł sprężystości przy ścinaniu. Oznacza to, że materiał traci elastyczność wraz ze wzrostem temperatury dla stałej częstotliwości. Przy częstotliwości 0,01 Hz Moduł sprężystościModuł zespolony (składnik sprężysty), moduł magazynowania lub G', jest "rzeczywistą" częścią ogólnego modułu zespolonego próbki. Ten składnik sprężysty wskazuje na stałą lub fazową reakcję mierzonej próbki. moduł sprężystości wzrasta z 1E-01 Pa w temperaturze 65°C do prawie 1E+07 Pa w temperaturze 5°C, co stanowi różnicę prawie 8 dekad! Ten silny wpływ temperatury wyjaśnia również zmienność właściwości asfaltu w zależności od pory roku. W zimie drogi mogą być kruche z tendencją do pękania, podczas gdy w bardzo gorące lata mogą stać się lepkie. Jest to powód, dla którego projektuje się różne klasy lepiszcza, aby dostosować je do różnych warunków w zależności od kraju, stanu/regionu i zastosowania (np. droga wiejska vs. autostrada).
Krzywą wzorcową w temperaturze referencyjnej 25°C (czarna krzywa) uzyskuje się poprzez przesunięcie punktów przemiatania częstotliwości w różnych temperaturach (patrz przykładowe punkty na rysunku 1). Im wyższa temperatura, tym bardziej elastyczne łańcuchy polimerowe i szybsza ruchliwość cząsteczek. Dlatego proces relaksacji, który ma miejsce w niższej temperaturze i niższej częstotliwości, jest taki sam dla wyższej temperatury i wyższej częstotliwości.1
Krzywa wzorcowa (czarna krzywa) uzyskana w temperaturze referencyjnej 25°C rozciąga się od 1E-06 do 1E04 Hz, co oznacza rozszerzenie zakresu częstotliwości o prawie 7 dekad! Częstotliwość 1E-06 Hz odpowiada ponad 11 dniom. Taki czas trwania pomiaru tylko jednego punktu nie jest odpowiedni w praktyce. Dlatego TTS jest absolutnie niezbędny.
Rysunek 2 przedstawia krzywą wzorcową w temperaturze 25°C dla sprężystych i stratnych modułów ścinania. Pokazuje ona skrzyżowanie G´ i G" przy 11 Hz, co oznacza, że spoiwo staje się zdominowane elastycznie w skali czasowej krótszej niż 90 ms. Czas trwania częstotliwości krzyżowania odpowiada
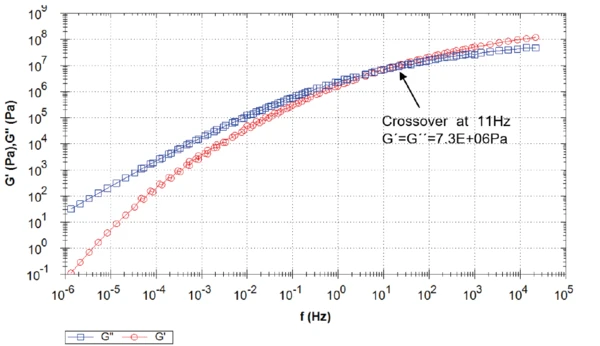
1 Więcej informacji na temat zależności czasu relaksacji od temperatury znajduje się w naszej nocie aplikacyjnej AN 256 (Superpozycja czasowo-temperaturowa na lepiszczu asfaltowym)
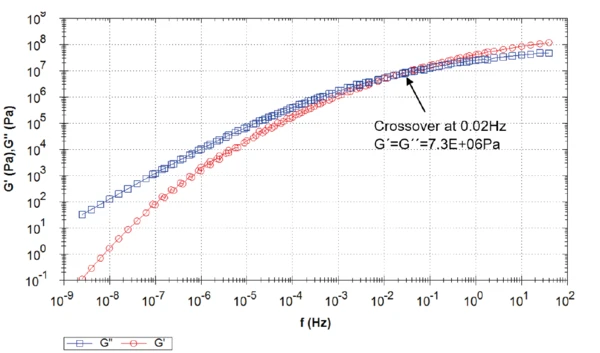
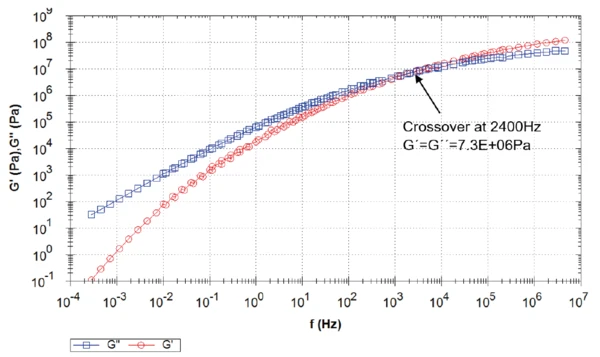
Dla porównania, krzywe wzorcowe zostały również utworzone dla temperatur referencyjnych 5°C (rysunek 3) i 45°C (rysunek 4). Im wyższa temperatura, tym wyższa częstotliwość zwrotnicy. Superpozycja czasowo-temperaturowa zakłada, że temperatura zmienia skalę czasową procesu relaksacji, ale nie ma wpływu na sam proces.
Wnioski
Superpozycja czasowo-temperaturowa (TTS) to łatwy sposób przewidywania krótko- i długoterminowego zachowania asfaltu bez wykonywania czasochłonnych pomiarów.
Oprogramowanie rSpace oblicza i wyświetla krzywą wzorcową dla temperatury zdefiniowanej przez użytkownika na podstawie pomiarów przemiatania częstotliwości w różnych temperaturach. Ten film wyjaśnia, jak wygenerować krzywą wzorcową w rSpace: