18.05.2023 by Claire Strasser, Aileen Sammler
Fast and Precise: DSC and PeakSeparation for the Identification of Polymers in Packaging Films
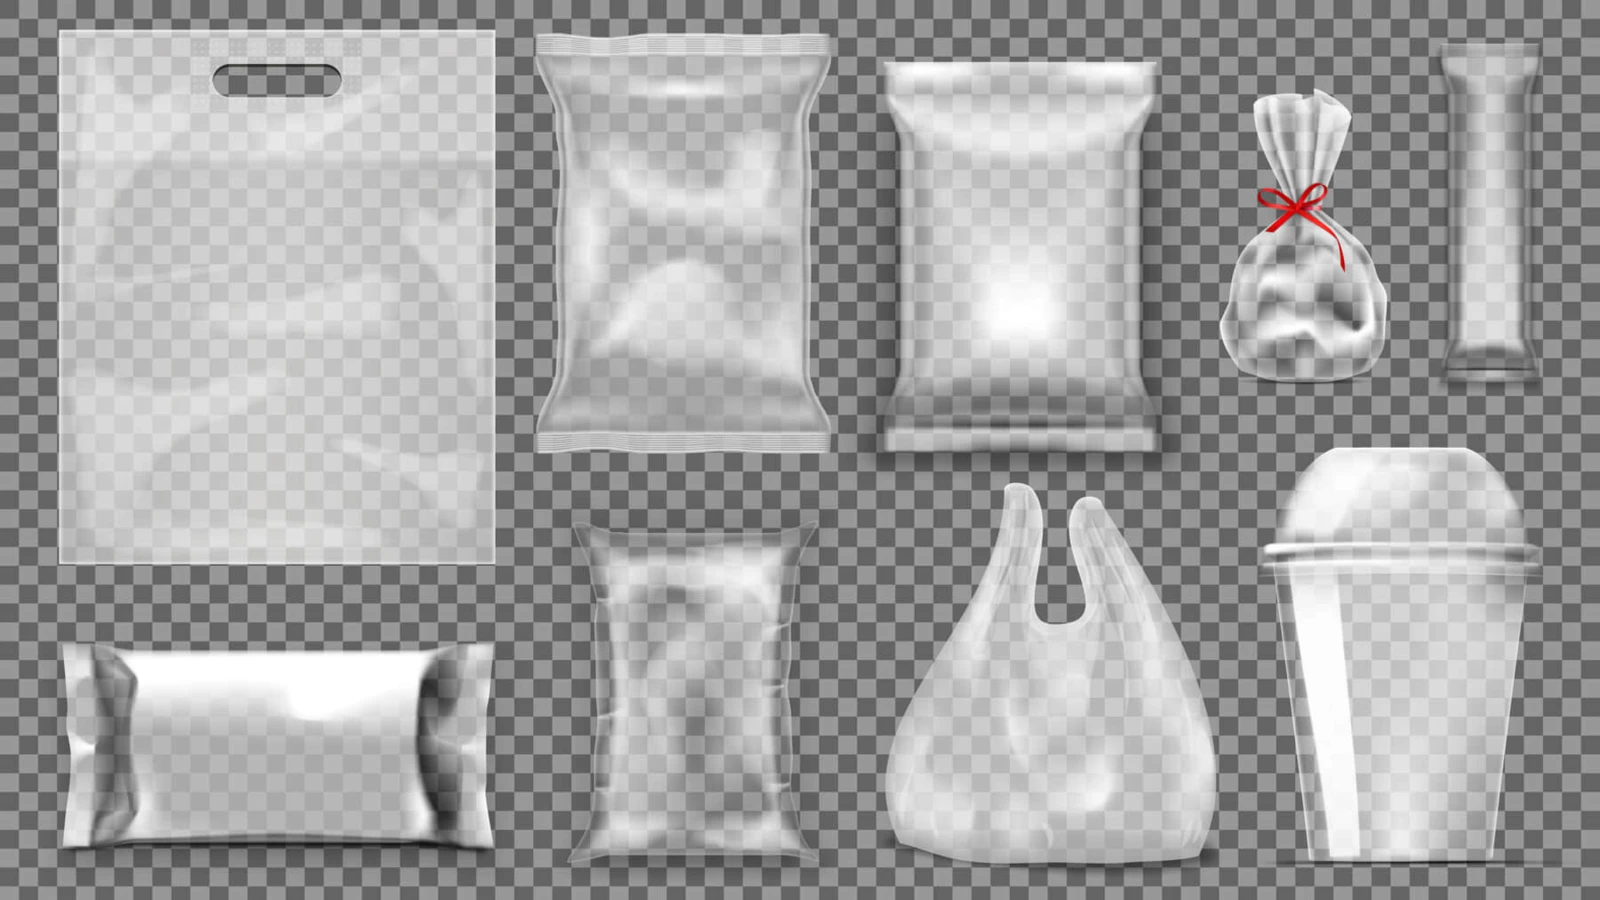
Transparent rigid films to keep sliced sausage and cheese fresh.
Stable yogurt cups.
Colorful, flexible coffee packaging.
Depending on the application, these highly developed products may need to be oxygen-tight, transparent or printable and possess a certain flexibility and/or stability. Such properties can only be achieved through the use of a variety of components, such as multiple polymer layers. To this end, polymers are, in turn, selected according to their own properties.
Learn how multi-layer packaging films can be investigated with regard to their composition by means of Differential Scanning Calorimetry (DSC) and the NETZSCH PeakSeparation Advanced Software Package.
For the identification of individual polymers in a multi-layer film, Differential Scanning Calorimetry has proven itself in the packaging industry as a fast and easily accessible method. In the following example, a commercially available composite film was investigated by means of a NETZSCH DSC instrument.
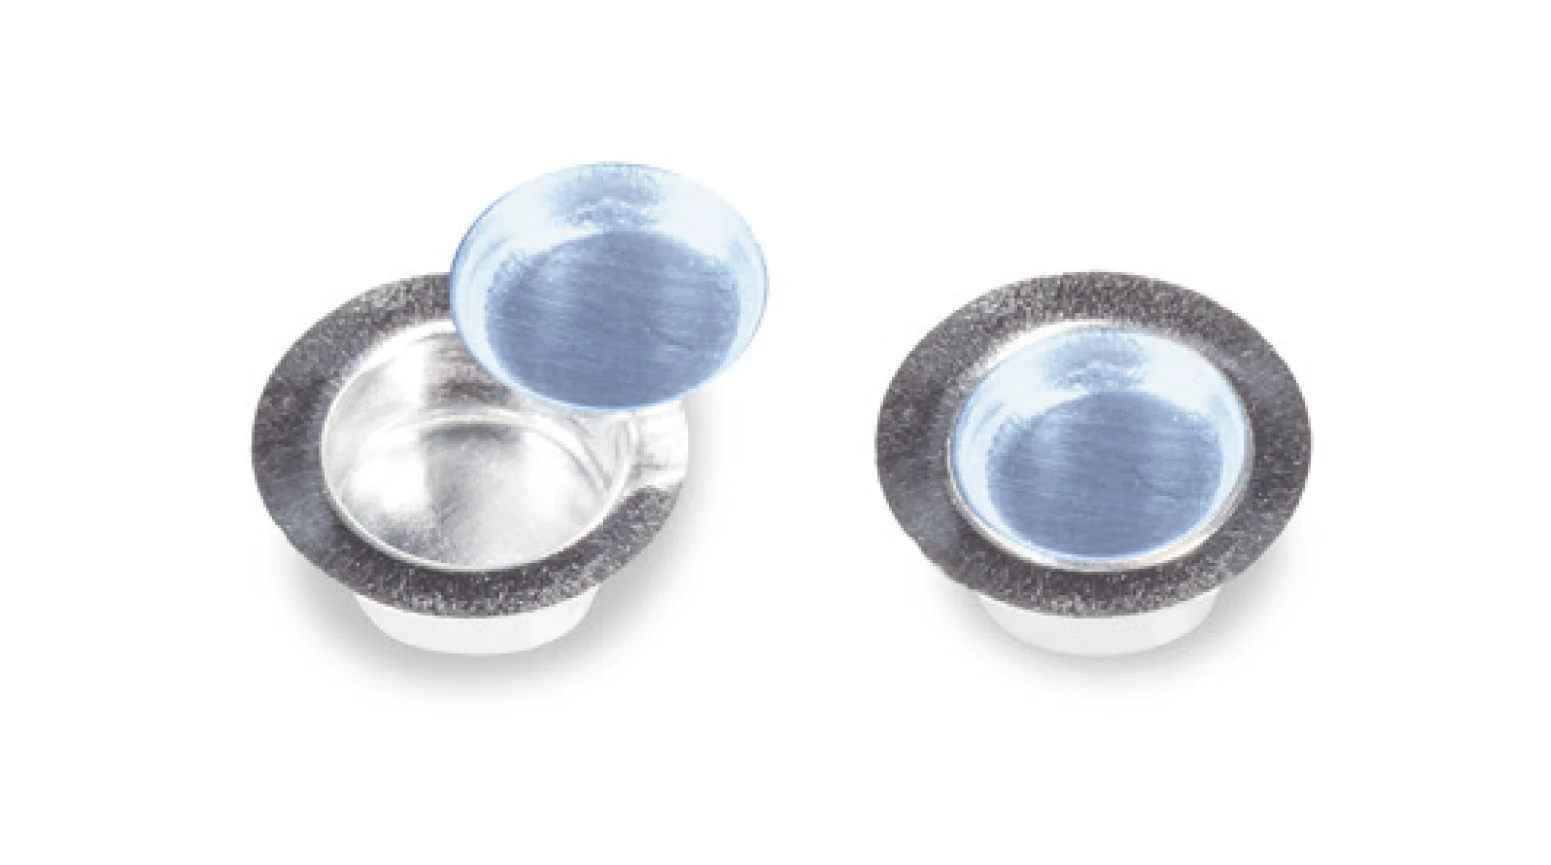
The sample was prepared in the Concavus®® crucible made of aluminum and evenly pressed onto the crucible bottom by means of a slide-in lid, which was specially developed for measurements on very thin samples such as films.
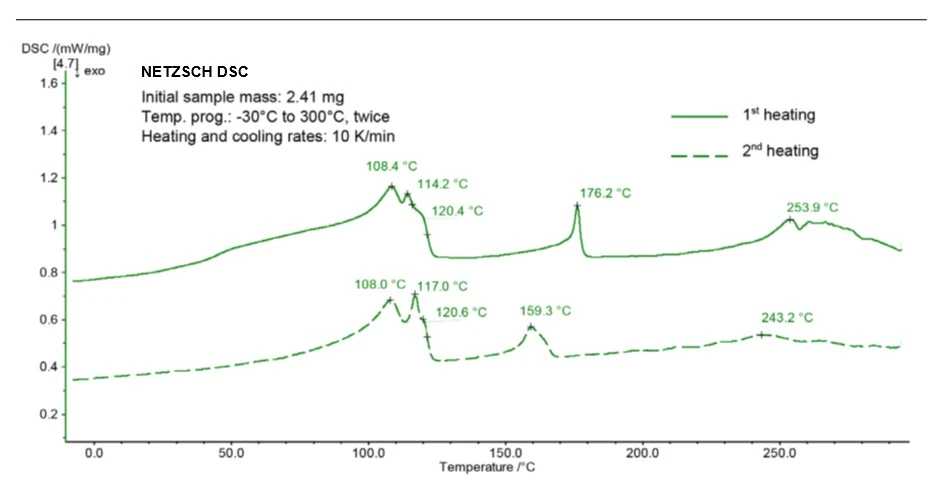
Figure 2 shows the results of the DSC measurement from the 1st and 2nd heating runs. In both heating runs, multiple overlapped peaks were detected between 108°C and 121°C. This indicates the presence of different polymers; the temperature range here is typical for various low-DensityThe mass density is defined as the ratio between mass and volume. density polyethylene types.
In the 1st heating, a peak at 176°C was additionally detected which indicates the presence of EVOH (polyethylene vinyl alcohol). EVOH is also known as a barrier plastic and is widely used in the packaging industry due to its good impermeability to substances such as oxygen. Its Melting Temperatures and EnthalpiesThe enthalpy of fusion of a substance, also known as latent heat, is a measure of the energy input, typically heat, which is necessary to convert a substance from solid to liquid state. The melting point of a substance is the temperature at which it changes state from solid (crystalline) to liquid (isotropic melt).melting temperature is dependent on its ethylene content; a Melting Temperatures and EnthalpiesThe enthalpy of fusion of a substance, also known as latent heat, is a measure of the energy input, typically heat, which is necessary to convert a substance from solid to liquid state. The melting point of a substance is the temperature at which it changes state from solid (crystalline) to liquid (isotropic melt).melting temperature of 176°C corresponds to an ethylene content of between 35 mol-% and 38 mol-% [1]. In the 2nd heating, the peak at 176°C is shifted to a lower temperature (159°C). This shift is probably due to the melting of a mixed phase formed between polyethylene and EVOH. The broad effect between 230°C and 280°C will be investigated in more detail in the following.
For this, the composite film was separated into two layers: a flexible, aluminum-colored film and a second, thinner, printed film. Between the two layers was an additional paper layer.
The two films on either side of the paper layer were measured separately from one another. The DSC curves are presented in figure 3.
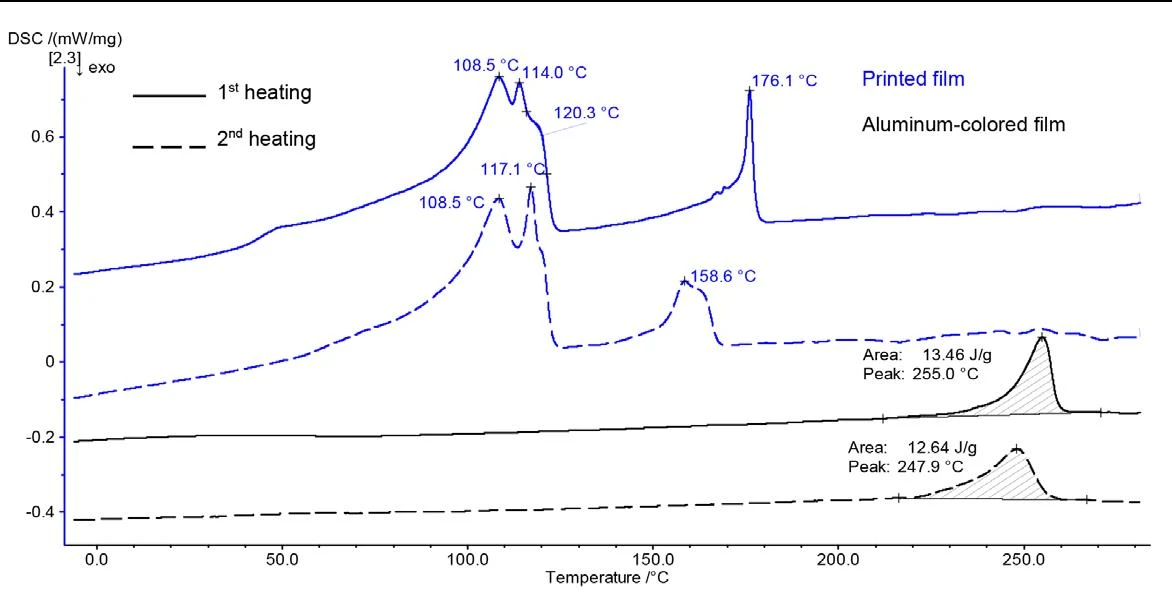
The printed film (blue curve, figure 3) – except for the peak at 253.9°C shown in figure 2– exhibits the same effects as the composite material as a whole. In contrast, the aluminum-colored film (black curve) produces only one peak, at 255°C (1st heating) and 248°C (2nd heating), respectively. This temperature range is typical for the melting of PET.
With these results, the following can be concluded about the composition of the composite film: The thinner, printed film consists of different polyethylene types as well as EVOH; the aluminum-colored one is PET. The appearance of the PET layer in terms of color indicates an aluminum coating which may be used, for example, as a light shield in packaging [2]. The aluminum melting peak (660.4°C) is outside the measured temperature range and was therefore not detected.
Identify Overlapping Peaks by means of the PeakSeparation program in Proteus®
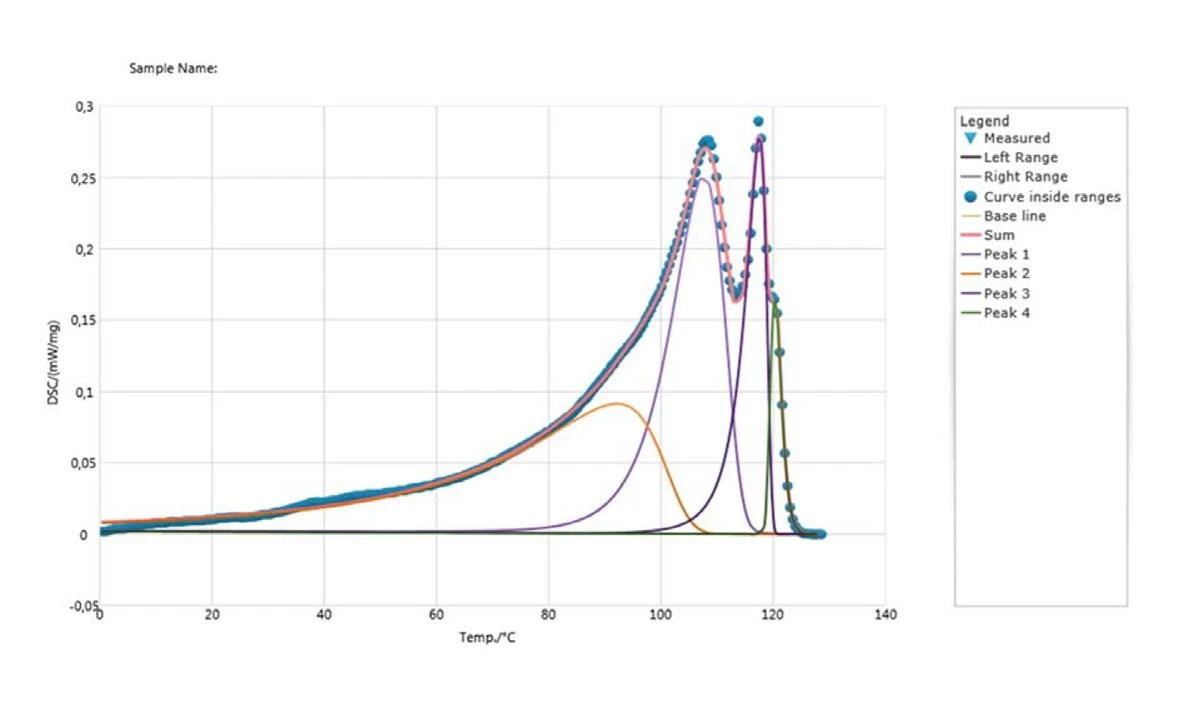
In order to clearly identify the three overlapping peaks between 108°C and 121°C detected during the measurement of the printed film, the DSC curve from the 2nd heating (blue dotted line, figure 3) was evaluated with the PeakSeparation program in the Proteus® software. PeakSeparation allows for the presentation of experimental data in the form of the additive overlapping of peaks. This program offers different curve types such as Pearson, Gauß, Cauchy, etc. Here, the Fraser-Suzuki curve progression along with a mixture of the Fraser- Suzuki- and asymmetrical Cauchy curve progression was selected. By applying these profiles to the measured DSC curve, it becomes possible to mathematically separate the superimposed peaks.
Figure 4 shows the results of the PeakSeparation. Four calculated peaks can be related to the experiment's DSC curve (blue dotted line). The peaks at 108°C, 118°C and 120°C are typical for different low-DensityThe mass density is defined as the ratio between mass and volume. density polyethylene types (PE-LD, PE-LLD).
An additional peak at 92°C (orange curve) can be attributed to the melting of small crystallites.
The correlation coefficient between the sum of the four calculated curves and the measured curve is determined to be 0.999 and thus confirms the good fit of the calculated endothermal peaks to the measured data.
Summary
DSC measurements yield valuable information on the composition of packaging films. These complex materials consist of different layers, which can sometimes be identified with just a single DSC measurement. The packaging shown in our example consists, at a minimum, of PET, EVOH and several polyethylene types of different densities.
The melting ranges of the different polymers often lie close together. However, complete separation of the peaks and/or precise material characterization can be achieved by means of careful sample preparation and the application of the PeakSeparationsoftware.
This program allows for the separation of overlapped peaks using profiles from the following peak types: Gaussian, Cauchy, pseudoVoigt (linear combination of Gaussian and Cauchy), Fraser-Suzuki (asymmetric Gaussian), modified Laplace (double-sided rounded) and Pearson. With it, the experimental data is fitted as an additive superposition of peaks. It can be applied to curves obtained by different analytical methods such as differential scanning calorimetry (DSC), thermogravimetry (TGA) and dilatometry (DIL), for FTIR-Traces and MS curves.
Price Reduction for the PeakSeparation Function
Take advantage! The price for the PeakSeparation function of Proteus® version 8 and 9 has now been significantly reduced! Ask your regional contact for an offer!
Stay tuned! Packaging applications make up around 50% of the plastic production. Since plastics have a poor biodegradability but are a valuable resource even after their service life, focusing on recycling pathways is now more important than ever. Next week we will talk about NETZSCH tools to identify and quantify different plastic compositions in the recycling stream!
Literature:
[1] Barrier Resins | Properties, Processing & Handling of EVOH, Pt. 1, Gene Medlock, February 02, 2015 http://bit.ly/17Ous83
[2] https://de.wikipedia.org/wiki/Verbundfolie