Introduction
Tar plays a crucial role in the production of battery-grade graphite anode materials. During the PyrolysisPyrolysis is the thermal decomposition of organic compounds in an inert atmosphere.pyrolysis at high temperatures, tar is carbonized and helps shape the anode particles. The softening point of the tar determines the temperature window within which the material can be sufficiently liquefied to ensure homogeneous distribution in the composite material. The higher the softening point of the tar, the more homogeneous the coating. After thermal treatment, the resulting carbonaceous residue remains dimensionally stable and has the required thermal and chemical resistance, which is essential for the operation of anodes in high-temperature processes [1]. Both the PyrolysisPyrolysis is the thermal decomposition of organic compounds in an inert atmosphere.pyrolysis process and the softening point can be investigated by means of thermal analysis. Four different types of tar were compared for their suitability for the production of anode material.
Methods and Sample Preparation
The thermogravimetric measurements to investigate the PyrolysisPyrolysis is the thermal decomposition of organic compounds in an inert atmosphere.pyrolysis process were carried out with the NETZSCH TG Libra®. The measurement conditions listed in table 1 were applied. DSC measurements were carried out with the NETZSCH DSC Caliris® to determine the Phase TransitionsThe term phase transition (or phase change) is most commonly used to describe transitions between the solid, liquid and gaseous states.phase transitions and softening temperature of the tar samples.
Table 1: Measurement conditions for the TGA measurements on different pitch samples
| Sample mass | 10 ± 0.1 mg |
|---|---|
| Crucible | 85 μl aluminum oxide, open |
| Heating rate | 10 K/min |
| Temperature program | 40 to 900°C in nitrogen; 900 to 1100°C in air |
| Purge gas flow | 40 ml/min |
Table 2: Measurement conditions for the DSC analysis of the different tar types
| Sample mass | 6 ± 0.1 mg |
|---|---|
| Crucible | Al, Concavus® type, cold-welded with pierced lid |
| Heating/cooling rates | 10 K/min |
| Purge gas flow | 40 ml/min |
| Purge gas | Nitrogen |
| Temperature range | 40 to 140°C / 200°C |
| Number of heatings | 2 |
Results and Discussion
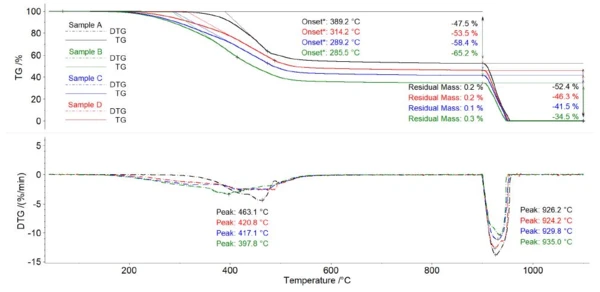
The thermogravimetrc measurements were conducted under inert conditions in the temperature range between 200°C and 550°C and show one single mass-loss step for each of the tar samples. The mass changes vary between 47.5% and 65.5%. This indicates that the content of organic components that are pyrolyzed in this temperature range differs.
Switching to an oxidizing atmosphere initiates combustion of the carbon content. The carbon content of the samples ranged between 34.4% and 52.4%. The remaining residual mass is referred to as the Ash ContentThe ash is a measure of the mineral oxide content on a weight basis. Thermogravimetric analysis (TGA) in an oxidative atmosphere is a well-proven method to determine the inorganic residue, commonly referred to ash, in organic materials such as polymers, rubbers, etc. Therefore, the TGA measurement will Identify if a material is filled and calculates the total filler content.ash content. Here, the four samples showed only very slight differences.
In addition to the carbon content and the Ash ContentThe ash is a measure of the mineral oxide content on a weight basis. Thermogravimetric analysis (TGA) in an oxidative atmosphere is a well-proven method to determine the inorganic residue, commonly referred to ash, in organic materials such as polymers, rubbers, etc. Therefore, the TGA measurement will Identify if a material is filled and calculates the total filler content.ash content of the tar samples, the Thermal StabilityA material is thermally stable if it does not decompose under the influence of temperature. One way to determine the thermal stability of a substance is to use a TGA (thermogravimetric analyzer). thermal stability also plays a decisive role. The maximum mass-loss rate (DTG peak) or the extrapolated onset temperature can be used to compare the Thermal StabilityA material is thermally stable if it does not decompose under the influence of temperature. One way to determine the thermal stability of a substance is to use a TGA (thermogravimetric analyzer). thermal stability of the different samples. Looking at these values in figure 1, it can be seen that sample A shows the highest Thermal StabilityA material is thermally stable if it does not decompose under the influence of temperature. One way to determine the thermal stability of a substance is to use a TGA (thermogravimetric analyzer). thermal stability and sample B the lowest.
With the help of thermogravimetry, different tar samples can therefore be analyzed with regard to their carbon yield during PyrolysisPyrolysis is the thermal decomposition of organic compounds in an inert atmosphere.pyrolysis, their Ash ContentThe ash is a measure of the mineral oxide content on a weight basis. Thermogravimetric analysis (TGA) in an oxidative atmosphere is a well-proven method to determine the inorganic residue, commonly referred to ash, in organic materials such as polymers, rubbers, etc. Therefore, the TGA measurement will Identify if a material is filled and calculates the total filler content.ash content and their Thermal StabilityA material is thermally stable if it does not decompose under the influence of temperature. One way to determine the thermal stability of a substance is to use a TGA (thermogravimetric analyzer). thermal stability. It was therefore possible to determine that sample A had both the highest carbon content and the highest Thermal StabilityA material is thermally stable if it does not decompose under the influence of temperature. One way to determine the thermal stability of a substance is to use a TGA (thermogravimetric analyzer). thermal stability.
In addition to the thermogravimetric analysis, the tar types were also examined with DSC analysis with regard to possible caloric effects, such as Glass Transition TemperatureThe glass transition is one of the most important properties of amorphous and semi-crystalline materials, e.g., inorganic glasses, amorphous metals, polymers, pharmaceuticals and food ingredients, etc., and describes the temperature region where the mechanical properties of the materials change from hard and brittle to more soft, deformable or rubbery.glass transition or melting. The measured DSC curves of the first and second heating can be seen in figure 2. Comparing the mass of the crucibles before and after the DSC analysis proved that the sample masses remain stable during the DSC process. In the first heating, tars D, C and B show an EndothermicA sample transition or a reaction is endothermic if heat is needed for the conversion.endothermic peak at 78.1°C, 68.3°C and 67.1°C. Tar A does not show an EndothermicA sample transition or a reaction is endothermic if heat is needed for the conversion.endothermic peak. Here, however, a slightly ExothermicA sample transition or a reaction is exothermic if heat is generated.exothermic course between 130°C and 190°C can be observed. After controlled cooling and reheating, the samples show different behavior than in the first heating, since the EndothermicA sample transition or a reaction is endothermic if heat is needed for the conversion.endothermic peaks no longer occur during the second heating. This is possibly a RelaxationWhen a constant strain is applied to a rubber compound, the force necessary to maintain that strain is not constant but decreases with time; this behavior is known as stress relaxation. The process responsible for stress relaxation can be physical or chemical, and under normal conditions, both will occur at the same time. relaxation effect. The EndothermicA sample transition or a reaction is endothermic if heat is needed for the conversion.endothermic peak can give some insight into the thermal history of the material.
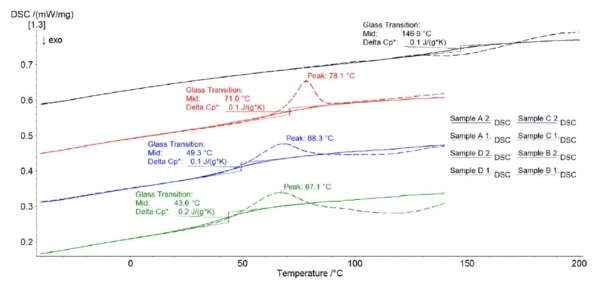
During the second heating, just one Glass Transition TemperatureThe glass transition is one of the most important properties of amorphous and semi-crystalline materials, e.g., inorganic glasses, amorphous metals, polymers, pharmaceuticals and food ingredients, etc., and describes the temperature region where the mechanical properties of the materials change from hard and brittle to more soft, deformable or rubbery.glass transition was detected for each sample. At 44°C, tar B has the lowest Glass Transition TemperatureThe glass transition is one of the most important properties of amorphous and semi-crystalline materials, e.g., inorganic glasses, amorphous metals, polymers, pharmaceuticals and food ingredients, etc., and describes the temperature region where the mechanical properties of the materials change from hard and brittle to more soft, deformable or rubbery.glass transition temperature. For tar types C and D, this is slightly higher at 50°C and 71°C, respectively. Sample A shows the highest Glass Transition TemperatureThe glass transition is one of the most important properties of amorphous and semi-crystalline materials, e.g., inorganic glasses, amorphous metals, polymers, pharmaceuticals and food ingredients, etc., and describes the temperature region where the mechanical properties of the materials change from hard and brittle to more soft, deformable or rubbery.glass transition temperature at 147°C.
Using DSC, it was possible to Identify clear differences in the Glass Transition TemperatureThe glass transition is one of the most important properties of amorphous and semi-crystalline materials, e.g., inorganic glasses, amorphous metals, polymers, pharmaceuticals and food ingredients, etc., and describes the temperature region where the mechanical properties of the materials change from hard and brittle to more soft, deformable or rubbery.glass transition temperatures and the pre-treatment of the samples. Sample A also stands out here with low residual StressStress is defined as a level of force applied on a sample with a well-defined cross section. (Stress = force/area). Samples having a circular or rectangular cross section can be compressed or stretched. Elastic materials like rubber can be stretched up to 5 to 10 times their original length.stress and the highest Glass Transition TemperatureThe glass transition is one of the most important properties of amorphous and semi-crystalline materials, e.g., inorganic glasses, amorphous metals, polymers, pharmaceuticals and food ingredients, etc., and describes the temperature region where the mechanical properties of the materials change from hard and brittle to more soft, deformable or rubbery.glass transition temperature.
Summary
TGA and DSC analyses are suitable methods for comprehensively identifying different types of tar with regard to their suitability for battery production. With the help of these techniques, it was possible to determine a variety of properties such as Thermal StabilityA material is thermally stable if it does not decompose under the influence of temperature. One way to determine the thermal stability of a substance is to use a TGA (thermogravimetric analyzer). thermal stability, carbon content, Ash ContentThe ash is a measure of the mineral oxide content on a weight basis. Thermogravimetric analysis (TGA) in an oxidative atmosphere is a well-proven method to determine the inorganic residue, commonly referred to ash, in organic materials such as polymers, rubbers, etc. Therefore, the TGA measurement will Identify if a material is filled and calculates the total filler content.ash content, thermo-mechanical history and characteristics of the Glass Transition TemperatureThe glass transition is one of the most important properties of amorphous and semi-crystalline materials, e.g., inorganic glasses, amorphous metals, polymers, pharmaceuticals and food ingredients, etc., and describes the temperature region where the mechanical properties of the materials change from hard and brittle to more soft, deformable or rubbery.glass transition.
This information can be used not only to check manufacturer specifications during incoming goods inspection, but also to optimize formulations and select suitable raw materials. The identification of a suitable starting substance in the run-up to battery production influences the quality of the end products and increases the efficiency of the manufacturing process.