Stylized graphic featuring multiple computers connected to the Kunststoff Institut Lüdenscheid logo, symbolizing polymer research and data analysis.

Success with Smart Data

In cooperation with the Kunststoff-Institut Lüdenscheid, NETZSCH-Gerätebau offers a polymer database for DSC analysis.

1.250
data sets for different material samples
174
different polymer types and blends
Automated
identification of polymer samples

Each material is labelled with the appropriate trade name. Information about colors and fillers is also available.

Additionally, updates and expansions of the database are offered on a regular basis.

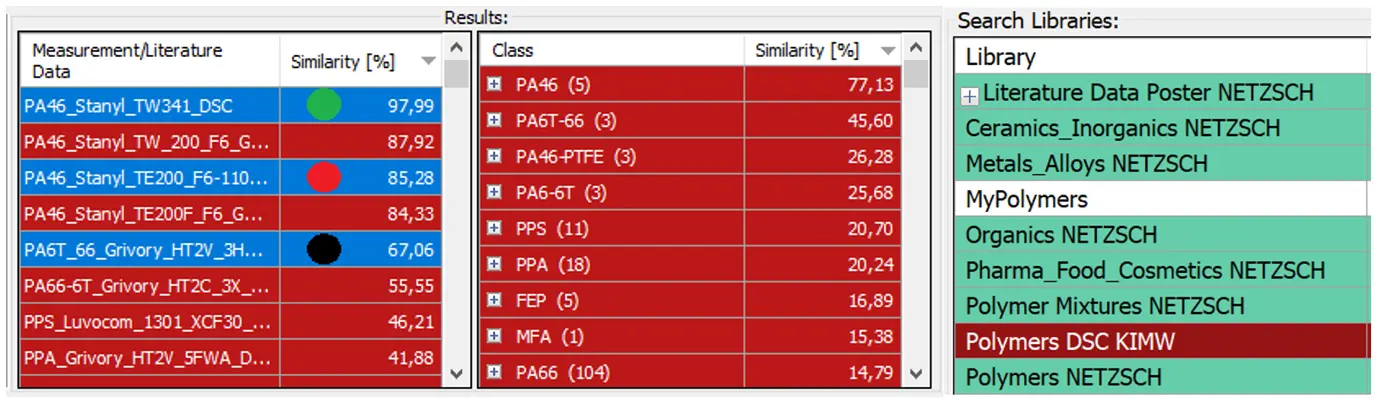
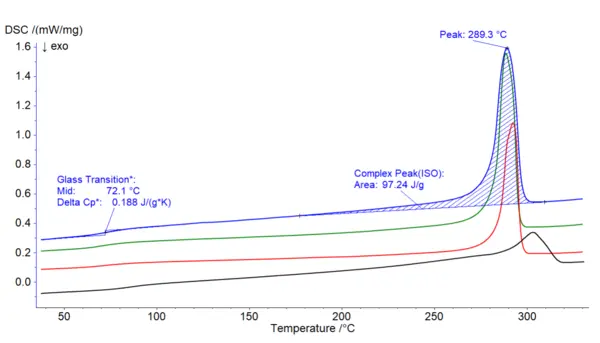
Integration of the extensive database of the Kunststoff-Institut Lüdenscheid into the Identify software for the identification of curves makes polymer applications considerably easier for DSC users.

Together with the automatic, user-independent evaluation of the DSC measurements by means of AutoEvaluation, faster assignment and more meaningful interpretation of the measurement results is possible.

Search results for unknown polymers showing similarity scores and classifications from the NETZSCH polymer database.
Database search results created with Identify. On the left, a hit list of one-on-one comparisons of the input DSC measurement with individual database measurements is shown. The hit list in the middle represents polymer types (denoted as classes) also sorted according to their similarity to the input measurement. The database measurements marked as green, red and black dots are displayed in the figure below. On the right, one can see the selection of libraries.
Search results for unknown polymers showing similarity scores and classifications from the NETZSCH polymer database.
Temperature-dependent DSC measurement on an unknown polymer sample (blue curve) in comparison with examples of database measurements with curve colors indicated in the figure above. Evaluation of the Glass Transition TemperatureThe glass transition is one of the most important properties of amorphous and semi-crystalline materials, e.g., inorganic glasses, amorphous metals, polymers, pharmaceuticals and food ingredients, etc., and describes the temperature region where the mechanical properties of the materials change from hard and brittle to more soft, deformable or rubbery.glass transition and the melting peak were autonomously created by the AutoEvaluation software functionality.

Please accept Marketing Cookies to see that Video.

How Proteus® can make your lab work more efficient

Contact

What's Identify?

Via database comparisons, it only takes a few seconds for Identify to recognize and classify materials. With a single click, experimental curves (even ones that have not yet been evaluated) can thus be checked for agreement with stored individual measurements, literature data or classes (groups of measurements and literature data).

AI Overview
An error occurred. Please try again.