Introduction
Epoxy resin (EP) is a general term for a large class of polymers containing more than two epoxy groups in the repeating units of the molecular chain. Epoxy resins are produced as a condensation product of epichlorohydrin and bisphenol A or polyol. Due to the chemical activity of the epoxy group, a variety of compounds can be employed as hardener components for cross-linking and Curing (Crosslinking Reactions)Literally translated, the term “crosslinking“ means “cross networking”. In the chemical context, it is used for reactions in which molecules are linked together by introducing covalent bonds and forming three-dimensional networks.curing. This generates a network structure which is not thermoplastic, but a thermoset polymer. Epoxy resins of the type bisphenol A are the most widely used thermosets, not only in terms of the volume of production, but also in terms of the wide range of variations or possible variations in the applications field. With the introduction of new, modified types, the quality is also constantly being improved.
Epoxy resins feature excellent physical and mechanical properties and are also ideally suited as electrical insulation materials. They are further characterized by their high level of compatibility with other materials. Contrary to other thermosetting plastics, epoxy resins are very flexible in their application and processability. They can therefore be used as coatings, composite materials, casting materials, adhesives, molding materials and injection molding materials.
Coordination of Material Properties
In order to coordinate material properties to the epoxy resin materials’ application range, it is necessary to firstly determine both the Curing (Crosslinking Reactions)Literally translated, the term “crosslinking“ means “cross networking”. In the chemical context, it is used for reactions in which molecules are linked together by introducing covalent bonds and forming three-dimensional networks.curing temperature and the Curing (Crosslinking Reactions)Literally translated, the term “crosslinking“ means “cross networking”. In the chemical context, it is used for reactions in which molecules are linked together by introducing covalent bonds and forming three-dimensional networks.curing heat of epoxy resins for processing; and secondly, to align the Glass Transition TemperatureThe glass transition is one of the most important properties of amorphous and semi-crystalline materials, e.g., inorganic glasses, amorphous metals, polymers, pharmaceuticals and food ingredients, etc., and describes the temperature region where the mechanical properties of the materials change from hard and brittle to more soft, deformable or rubbery.glass transition temperature of the material with the application.
Measurement Method
Differential Scanning Calorimetry (DSC) is the method of choice for determining the above-mentioned material properties. With this method, they can be determined relatively quickly with a high sample throughput. Often, however, these EP samples are partially cured materials; i.e., the original material is not fully cured. When such a sample is heated, it undergoes both the Glass Transition TemperatureThe glass transition is one of the most important properties of amorphous and semi-crystalline materials, e.g., inorganic glasses, amorphous metals, polymers, pharmaceuticals and food ingredients, etc., and describes the temperature region where the mechanical properties of the materials change from hard and brittle to more soft, deformable or rubbery.glass transition and post-Curing (Crosslinking Reactions)Literally translated, the term “crosslinking“ means “cross networking”. In the chemical context, it is used for reactions in which molecules are linked together by introducing covalent bonds and forming three-dimensional networks.curing. Since these two effects often occur in very close proximity to each other or even overlap in terms of temperature, conventional DSC methods executed at a constant heating rate often do not yield satisfactory test results – neither in the first nor in the second heating. In such cases, the temperature-modulated DSC (TM-DSC) method must be used to obtain more meaningful results.
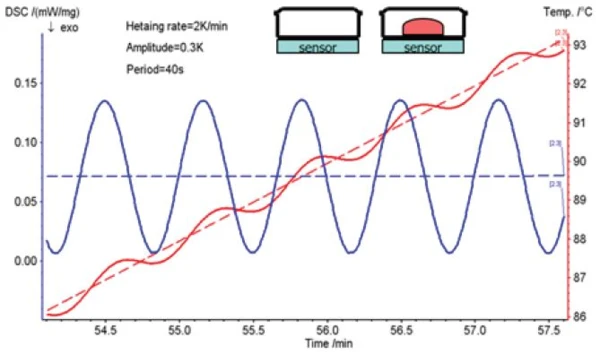
With the TM-DSC method, the sample is not heated at a constant heating rate as with the conventional DSC method, but by means of a sinusoidal modulation of temperature. The corresponding heating rate is a cosinusoidal waveform. When this cosinusoidal heating rate is applied to the sample, the response is also a cosinusoidal heat flow as a signal with a certain phase delay (figure 1).
Measurement Results
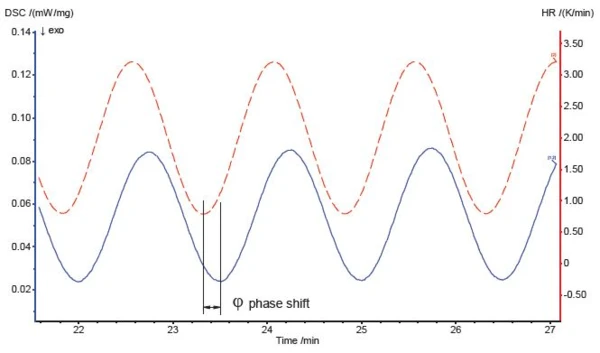
By analyzing the sinusoidal or cosinusoidal signal while taking the baseline, amplitude and phase-shift corrections into account, it is possible to separate two independent curves, the reversing heat-flow and the non-reversing heat-flow, from the overall heat-flow signal curve (figure 2).
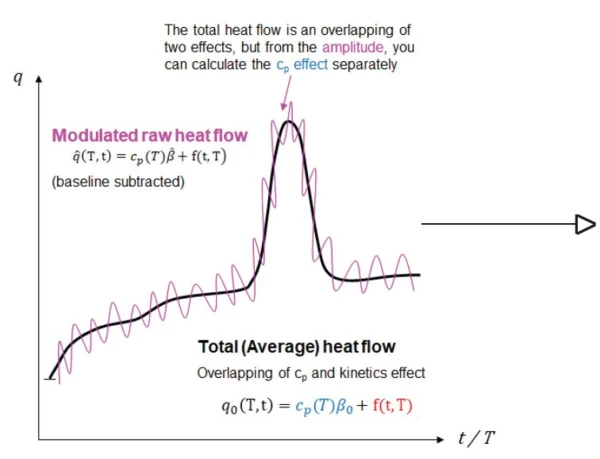
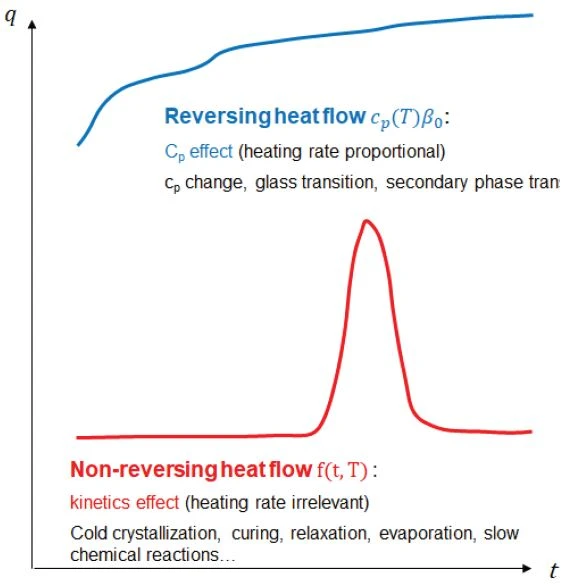
The heat-capacity effects (the “step transitions” on the curve, such as Glass Transition TemperatureThe glass transition is one of the most important properties of amorphous and semi-crystalline materials, e.g., inorganic glasses, amorphous metals, polymers, pharmaceuticals and food ingredients, etc., and describes the temperature region where the mechanical properties of the materials change from hard and brittle to more soft, deformable or rubbery.glass transition, Curie point transition, second-order Phase TransitionsThe term phase transition (or phase change) is most commonly used to describe transitions between the solid, liquid and gaseous states.phase transitions, heat capacity changes before and after the reaction, etc.) of the material occur in the reversing heat-flow curve during heating.
Kinetic effects (such as cold CrystallizationCrystallization is the physical process of hardening during the formation and growth of crystals. During this process, heat of crystallization is released.crystallization, ExothermicA sample transition or a reaction is exothermic if heat is generated.exothermal Curing (Crosslinking Reactions)Literally translated, the term “crosslinking“ means “cross networking”. In the chemical context, it is used for reactions in which molecules are linked together by introducing covalent bonds and forming three-dimensional networks.curing, enthalpy RelaxationWhen a constant strain is applied to a rubber compound, the force necessary to maintain that strain is not constant but decreases with time; this behavior is known as stress relaxation. The process responsible for stress relaxation can be physical or chemical, and under normal conditions, both will occur at the same time. relaxation, evaporation of solvents and water, chemical reactions, Decomposition reactionA decomposition reaction is a thermally induced reaction of a chemical compound forming solid and/or gaseous products. decomposition, etc.) occur in the non-reversing heat-flow curve. This allows for overlapping thermal effects to be separated.
For an epoxy resin, the Glass Transition TemperatureThe glass transition is one of the most important properties of amorphous and semi-crystalline materials, e.g., inorganic glasses, amorphous metals, polymers, pharmaceuticals and food ingredients, etc., and describes the temperature region where the mechanical properties of the materials change from hard and brittle to more soft, deformable or rubbery.glass transition is a heat capacity effect and post-curing is a kinetic effect. On a single heat-flow curve from a conventional DSC measurement, these two processes overlap and cancel each other out if the temperature ranges are similar. By means of TM-DSC measurements, however, these two processes are clearly separated into two independent heat-flow curves and the two effects can be analyzed and quantified independently of each other.
TM-DSC Applications
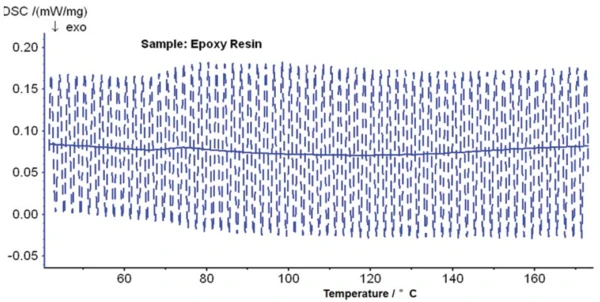
Figure 3 shows the raw DSC data of an epoxy resin analyzed by means of TM-DSC. The blue curve (solid line) in the diagram is the average heat-flow curve (also known as the total heat-flow curve), obtained by Fourier analysis of the raw data of the heat-flow signal (dashed line). The total heat-flow curve corresponds to the result of a conventional DSC measurement. From this curve alone, it is not obvious whether the Glass Transition TemperatureThe glass transition is one of the most important properties of amorphous and semi-crystalline materials, e.g., inorganic glasses, amorphous metals, polymers, pharmaceuticals and food ingredients, etc., and describes the temperature region where the mechanical properties of the materials change from hard and brittle to more soft, deformable or rubbery.glass transition or post-crosslinking is being portrayed. An inexperienced DSC user might only recognize a slightly curved “baseline”, and possibly also a very weak effect in the range from 60°C to 100°C, for which it is not clear whether the effect is endothermal or ExothermicA sample transition or a reaction is exothermic if heat is generated.exothermal.
With the help of temperature modulation, the results presented in figure 4 are obtained. The blue curve is again the total heat-flow curve. The red curve is the reversing heat-flow curve, which clearly shows the glass transition at 71°C (step evaluated as midpoint according to the half-step method) and reveals a change in specific heat of 0.378 J/(g·K). In the reversing DSC curve, the glass transition step is much more clearly recognizable than in the total DSC curve.
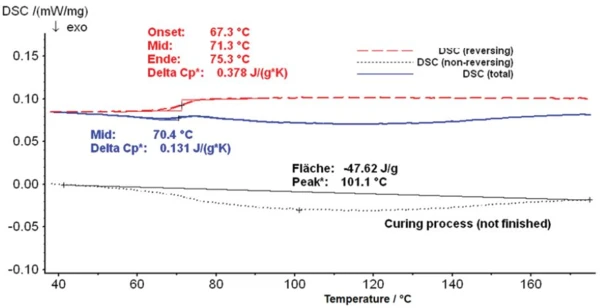
The black dashed line, on the other hand, is the non-reversing heat-flow curve, which shows a very broad ExothermicA sample transition or a reaction is exothermic if heat is generated.exothermal effect corresponding to the post-curing process. The peak temperature is 101.1°C and the enthalpy for this effect amounts to 47.62 J/g.
It can be seen from the two curves that the glass transition of the sample and the post-curing overlap somewhat in the temperature interval. The ExothermicA sample transition or a reaction is exothermic if heat is generated.exothermal effect of the sample starts at approx. 50°C; it is thus already in the range of the change in heat capacity at the glass transition, and partially compensates for this. As a result, the two effects cannot be clearly analyzed in the total heat-flow or in the heat-flow curves which can be measured by conventional DSC. Only with the temperature-modulation method is it possible to separate the effects. The effects separated this way can now be analyzed separately, providing precise values for the post-crosslinking enthalpy and the Glass Transition TemperatureThe glass transition is one of the most important properties of amorphous and semi-crystalline materials, e.g., inorganic glasses, amorphous metals, polymers, pharmaceuticals and food ingredients, etc., and describes the temperature region where the mechanical properties of the materials change from hard and brittle to more soft, deformable or rubbery.glass transition temperature.
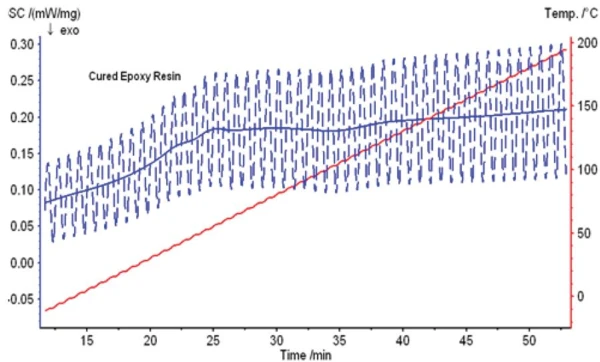
Figure 5 depicts the raw data for a TM-DSC measurement on another epoxy resin sample. From the mean heat-flow curve (blue solid line), we can see that several thermal effects occur between room temperature and 150°C. But are these effects EndothermicA sample transition or a reaction is endothermic if heat is needed for the conversion.endothermic or ExothermicA sample transition or a reaction is exothermic if heat is generated.exothermic effects or Phase TransitionsThe term phase transition (or phase change) is most commonly used to describe transitions between the solid, liquid and gaseous states.phase transitions? Where are the appropriate initial and end temperatures for analyzing the respective effects? For an inexperienced user, analyzing the measurement results may be very difficult.
After separating the TM-DSC measurement into a reversing and non-reversing DSC curve, however, the results shown in figure 6 can be obtained.
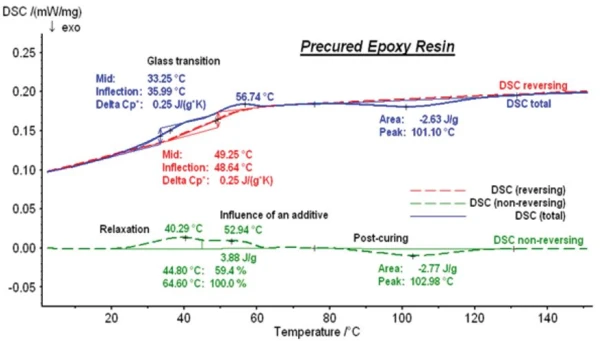
The blue curve still is the total heat-flow curve. The red curve is the reversing DSC curve with a significant step which corresponds to the glass transition of the material with a Glass Transition TemperatureThe glass transition is one of the most important properties of amorphous and semi-crystalline materials, e.g., inorganic glasses, amorphous metals, polymers, pharmaceuticals and food ingredients, etc., and describes the temperature region where the mechanical properties of the materials change from hard and brittle to more soft, deformable or rubbery.glass transition temperature, Tg, of 49.3°C (midpoint). Thus, the correctly evaluated glass transition is 16°C higher than the evaluation of the apparent step in the total DSC curve.
The green dashed line depicts the non-reversing DSC curve. With the help of the unique FRC correction function1 of the NETZSCH TM-DSC, the baseline here is horizontal, allowing for endothermal and ExothermicA sample transition or a reaction is exothermic if heat is generated.exothermal effects to be clearly distinguished. The endothermal effect at 40.3°C represents a RelaxationWhen a constant strain is applied to a rubber compound, the force necessary to maintain that strain is not constant but decreases with time; this behavior is known as stress relaxation. The process responsible for stress relaxation can be physical or chemical, and under normal conditions, both will occur at the same time. relaxation effect which is superimposed on the glass transition in this temperature range. The other endothermal effect at 52.9°C is the melting of an additive. Post-curing can now be observed as an exothermal effect with a peak temperature of 103°C and an enthalpy of 2.77 J/g.
1 The FRC correction of the heat flow is a correction which takes the frequency, the dependence of thermal resistance between the sample and sample crucible on temperature as well as the dependence of the sample's heat capacity on temperature into account.
Determination of the Glass Transition Temperature of Another Epoxy Resin
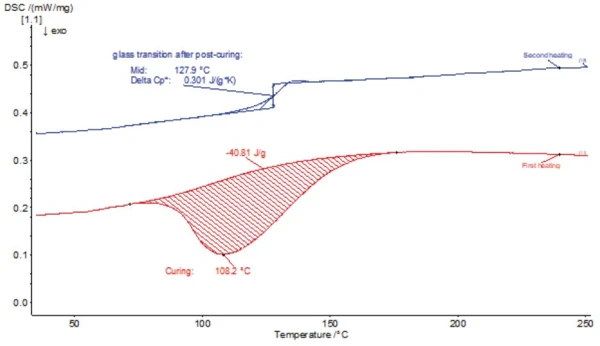
The third sample was another epoxy resin with the aim of determining the Glass Transition TemperatureThe glass transition is one of the most important properties of amorphous and semi-crystalline materials, e.g., inorganic glasses, amorphous metals, polymers, pharmaceuticals and food ingredients, etc., and describes the temperature region where the mechanical properties of the materials change from hard and brittle to more soft, deformable or rubbery.glass transition temperature. First, the sample was tested using the conventional DSC method (see figure 7) at a linear heating rate of 10 K/min. In the 1st heating (red curve), only a strong exothermal curing effect was detected, but no glass transition. Only during the 2nd heating (blue curve) of the same sample was a more pronounced glass transition visible as a step (due to the change in Specific Heat Capacity (cp)Heat capacity is a material-specific physical quantity, determined by the amount of heat supplied to specimen, divided by the resulting temperature increase. The specific heat capacity is related to a unit mass of the specimen.specific heat capacity at the glass transition) in the DSC signal.
With the conventional DSC method without temperature modulation, the glass transition can only be measured in the 2nd heating. In the 1st heating, the glass transition is superimposed by the exothermal effect of post-curing. The glass transition, determined on the basis of the 2nd heating, was 128°C (Tg (midpoint)). This Glass Transition TemperatureThe glass transition is one of the most important properties of amorphous and semi-crystalline materials, e.g., inorganic glasses, amorphous metals, polymers, pharmaceuticals and food ingredients, etc., and describes the temperature region where the mechanical properties of the materials change from hard and brittle to more soft, deformable or rubbery.glass transition temperature, however, significantly deviates from the expected value between 80°C and 90°C.
This discrepancy can be explained by the fact that the Glass Transition TemperatureThe glass transition is one of the most important properties of amorphous and semi-crystalline materials, e.g., inorganic glasses, amorphous metals, polymers, pharmaceuticals and food ingredients, etc., and describes the temperature region where the mechanical properties of the materials change from hard and brittle to more soft, deformable or rubbery.glass transition temperature is shifted to a higher temperature in the 2nd heating due to post-crosslinking during the 1st heating. Because of this, only the glass transition of the fully crosslinked sample can be determined with this method. It is not possible to detect the glass transition temperature of the only partially crosslinked material using this method.
This problem can only be solved by the TM-DSC method. The results are shown in figure 8.
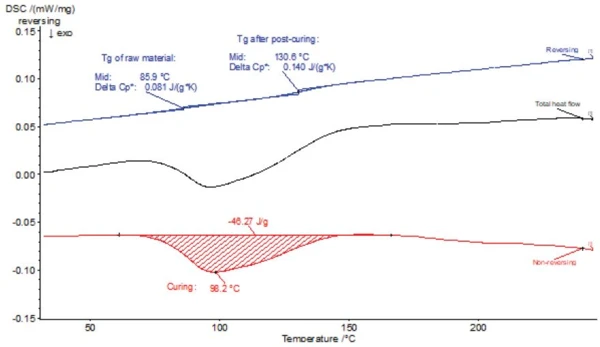
The modulated DSC measurement was carried out with only one single heating. The black curve is the total heat-flow curve corresponding to the conventional DSC measurement. Evaluation of the TM-DSC measurement shows the exothermal post-crosslinking effect in the non-reversing DSC curve (red). Due to the horizontal baseline, the peak temperature and enthalpy can be accurately evaluated.
The reversing DSC curve (blue) now shows the glass transition at 85.9°C (midpoint), so this glass transition temperature is within expected temperature range. Furthermore, a second glass transition temperature is very close to the value that could be determined during the 2nd heating with the conventional DSC method.
This phenomenon can be explained as follows: In the TM-DSC method, the glass transition temperature changes continuously during the post-crosslinking effect. The first glass transition corresponds to the Tg of the raw material before post-curing, while the second glass transition corresponds to the Tg of the almost fully cross-linked material during post-curing towards the end. TM-DSC could therefore also be designated as an "in-situ analysis method", as the change in glass transition temperature can be observed during a single heating. This is a clear advantage over conventional DSC.
Summary
Epoxy resins are a versatile and therefore widely used polymer material that cures thermally. Therefore, routine DSC testing is often carried out on this polymer material. Many of these samples are partially cured samples on which the glass transition temperature and the post-curing process are to be tested. These two thermal effects are often in the same temperature range and therefore overlap in a conventional DSC measurement at a linear heating rate. Quantitative evaluation of the results is thus often not possible. Even if a 2nd heating is carried out, this problem cannot be solved, as the state of the sample will have changed after the 1st heating. The glass transition temperature, which is determined on the basis of the 2nd heating, would no longer correspond to the original glass transition temperature.
This problem can only be solved with the aid of temperature-modulated DSC (TM-DSC). Due to the fundamental differences between the thermal effects of the glass transition and the curing, the two reveal themselves in TM-DSC measurements in both the reversing DSC curve (glass transition) and in the non-reversing DSC curve (curing effect). This means that these two effects can be analyzed and quantitatively determined independently of each other. TM-DSC separates the glass transition not only from curing effects, but also from other overlapping thermal effects such as RelaxationWhen a constant strain is applied to a rubber compound, the force necessary to maintain that strain is not constant but decreases with time; this behavior is known as stress relaxation. The process responsible for stress relaxation can be physical or chemical, and under normal conditions, both will occur at the same time. relaxation effects. The glass transition effect can be clearly recognized in the reversing DSC curve; therefore, the evaluation of the glass transition temperature is more precise and the results are more reliable.
In addition, TM-DSC can be called an “in-situ analysis method”. With only a single heating, not only can the glass transition temperature of the original state of the sample be determined, but in some cases the glass transition temperature of the fully cured sample can as well.