Introduction
À l'état fondu, les chaînes de polymère d'un polymère semi-cristallin sont désordonnées. Lors du refroidissement, certaines d'entre elles se réarrangent pour former des régions ordonnées et se cristalliser. Outre cette phase cristalline, un polymère semi-cristallin contient également une phase amorphe sans structure moléculaire ordonnée (voir figure 1). Le refroidissement n'entraîne pas la CristallisationLa cristallisation est le processus physique de durcissement au cours de la formation et de la croissance des cristaux. Au cours de ce processus, la chaleur de cristallisation est libérée.cristallisation de cette phase, mais le passage d'un état mou à un état dur et cassant. Cette transition est appelée transition vitreuse.
Différentes méthodes permettent de caractériser la CristallisationLa cristallisation est le processus physique de durcissement au cours de la formation et de la croissance des cristaux. Au cours de ce processus, la chaleur de cristallisation est libérée.cristallisation et la transition vitreuse des polymères, fournissant ainsi une variété d'informations précieuses.
La calorimétrie différentielle à balayage (DSC) est une méthode typique d'analyse des transitions thermiques. Elle fournit des informations sur la transition vitreuse, les transformations de phase telles que la CristallisationLa cristallisation est le processus physique de durcissement au cours de la formation et de la croissance des cristaux. Au cours de ce processus, la chaleur de cristallisation est libérée.cristallisation/Températures et enthalpies de fusionL'enthalpie de fusion d'une substance, également connue sous le nom de chaleur latente, est une mesure de l'apport d'énergie, généralement de la chaleur, nécessaire pour convertir une substance de l'état solide à l'état liquide. Le point de fusion d'une substance est la température à laquelle elle passe de l'état solide (cristallin) à l'état liquide (fusion isotrope). fusion ou les Transitions de phaseLe terme de transition de phase (ou changement de phase) est le plus souvent utilisé pour décrire les transitions entre les états solide, liquide et gazeux.transitions de phase solide-solide et le degré de cristallinité, etc. Sa facilité d'utilisation et sa capacité à automatiser les étapes de mesure en ont fait une technique populaire et largement utilisée.
La CristallisationLa cristallisation est le processus physique de durcissement au cours de la formation et de la croissance des cristaux. Au cours de ce processus, la chaleur de cristallisation est libérée.cristallisation et la transition vitreuse ont une influence significative sur les propriétés mécaniques d'un produit. La rhéologie est une autre méthode pour déterminer ces paramètres. Une mesure effectuée à l'aide d'un rhéomètre rotatif fournit des informations sur les changements rhéologiques qui se produisent lors du refroidissement d'un polymère semi-cristallin de l'état fondu à l'état vitreux. Dans ce qui suit, le comportement de refroidissement du polyéther éther cétone (PEEK) (voir la structure chimique dans la figure 2) est déterminé à l'aide du DSC 303 Caliris® et du rhéomètre rotatif Kinexus.


Paramètres de mesure
L'échantillon de PEEK a été chauffé à une température supérieure à sa Températures et enthalpies de fusionL'enthalpie de fusion d'une substance, également connue sous le nom de chaleur latente, est une mesure de l'apport d'énergie, généralement de la chaleur, nécessaire pour convertir une substance de l'état solide à l'état liquide. Le point de fusion d'une substance est la température à laquelle elle passe de l'état solide (cristallin) à l'état liquide (fusion isotrope). température de fusion. Après une phase IsothermeLes essais à température contrôlée et constante sont dits isothermes.isotherme, le polymère a été refroidi à une vitesse de refroidissement contrôlée. Les vitesses de refroidissement standard des méthodes respectives ont été utilisées, c'est-à-dire 10 K/min pour le DSC 300 Caliris® et 2 K/min pour le rhéomètre rotatif Kinexus. Le tableau 1 résume les conditions de mesure.
Tableau 1 : Paramètres de mesure
| Instrument | DSC 300 Caliris® | Kinexus HTC Prime |
| Creuset | Concavus® (aluminium) | - |
| Masse de l'échantillon | 9.80 mg | - |
| Programme de température | 370° à 30°C | 400°C à 40°C |
| Vitesse de refroidissement | 10 K/min | 2 K/min |
| Atmosphère | Azote (40 ml/min) | Azote (1 ml/min) |
| Géométrie | - | PP8 (plaque-plaque, diamètre : 8 mm) |
| Écart | - | 1 mm |
| Déformation par cisaillement | - | Dans le domaine linéaire-viscoélastique (Région viscoélastique linéaire (LVER)Dans le LVER, les contraintes appliquées ne sont pas suffisantes pour provoquer une rupture de la structure, ce qui permet de mesurer d'importantes propriétés micro-structurelles.LVER) |
| Fréquence | - | 1 Hz |
DSC 300 Caliris®: Comportement de cristallisation
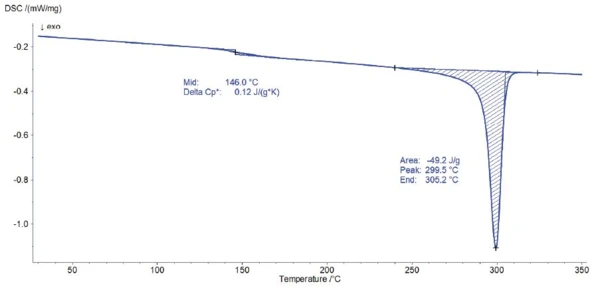
La figure 3 présente la courbe résultante de la mesure DSC effectuée sur le PEEK. Le pic ExothermiqueUne transition d'échantillon ou une réaction est exothermique si elle produit de la chaleur.exothermique commençant à 305°C (température d'endormissement) est dû à la CristallisationLa cristallisation est le processus physique de durcissement au cours de la formation et de la croissance des cristaux. Au cours de ce processus, la chaleur de cristallisation est libérée.cristallisation du PEEK. L'étape de la courbe DSC dont le point médian se situe à 146°C correspond à la transition vitreuse.
Rhéomètre rotatif Kinexus : Rigidité
Les figures 4 et 5 illustrent les courbes typiques résultant du balayage de température effectué sur le PEEK.


Si aucune réaction ne se produit, la viscosité de cisaillement complexe (figure 4) augmente avec la diminution de la température. C'est l'influence attendue de la température sur la rigidité en l'absence de processus physique ou chimique, car la mobilité des chaînes de polymères augmente pendant le chauffage.
L'état de Températures et enthalpies de fusionL'enthalpie de fusion d'une substance, également connue sous le nom de chaleur latente, est une mesure de l'apport d'énergie, généralement de la chaleur, nécessaire pour convertir une substance de l'état solide à l'état liquide. Le point de fusion d'une substance est la température à laquelle elle passe de l'état solide (cristallin) à l'état liquide (fusion isotrope). fusion est également caractérisé par la domination de G" sur G' (figure 5). En d'autres termes, à cette température, les propriétés "liquides" ont plus d'influence sur le comportement de déformation du PEEK que les propriétés "solides". Le polymère s'écoule pendant l'échelle de temps de la fréquence appliquée, même s'il présente encore de fortes propriétés élastiques (valeur de l'angle de phase plus proche de la valeur 45° que de 90°).
A 325°C, la pente de la courbe de viscosité de cisaillement complexe change (Figure 4). La viscosité de cisaillement complexe passe de 7,7E+03 Pa∙s à 325°C à 9,0E+06 Pa∙s à 295°C, soit une augmentation de plus de 3 décennies en seulement 30°C ! Cette augmentation significative est typique de la CristallisationLa cristallisation est le processus physique de durcissement au cours de la formation et de la croissance des cristaux. Au cours de ce processus, la chaleur de cristallisation est libérée. cristallisation d'un polymère cristallin ou semi-cristallin.
Le processus affecte également considérablement les modules de cisaillement élastique (G') et visqueux (G") (figure 5). Les deux courbes augmentent et montrent un croisement à 308°C. Entre la CristallisationLa cristallisation est le processus physique de durcissement au cours de la formation et de la croissance des cristaux. Au cours de ce processus, la chaleur de cristallisation est libérée. cristallisation et la transition vitreuse, la phase amorphe se trouve dans le plateau caoutchouteux. Les chaînes de polymères appartenant à la phase amorphe sont encore libres de se déplacer, tandis que la phase cristalline donne une structure au produit.
Plus le degré de cristallinité est élevé, plus la valeur du module de cisaillement élastique est importante. L'angle de phase se situe entre 2° et 3°, de sorte que le polymère est maintenant proche d'un solide élastique parfait.
Transition vitreuse
La transition vitreuse est atteinte lors de la poursuite du refroidissement. La rigidité continue d'augmenter, mais pas de manière aussi significative que pendant la CristallisationLa cristallisation est le processus physique de durcissement au cours de la formation et de la croissance des cristaux. Au cours de ce processus, la chaleur de cristallisation est libérée. cristallisation (3,0E+07 Pa∙s à 200°C à 1,6E+08 Pa∙s à 140°C, figure 4).
Alors que la température de transition vitreuse est généralement évaluée à l'aide de la température maximale, qui est typique des courbes de G" et δ (figure 5), le refroidissement au-dessus de la transition vitreuse est également lié à une augmentation de la courbe G'. À des températures inférieures à la température de transition vitreuse, l'angle de phase diminue à nouveau et est proche de 0. Le polymère est dans un état vitreux et rigide.
Conclusion
Cet exemple d'application montre comment la DSC et la rhéologie rotationnelle se complètent. Les deux méthodes fournissent des informations différentes décrivant la CristallisationLa cristallisation est le processus physique de durcissement au cours de la formation et de la croissance des cristaux. Au cours de ce processus, la chaleur de cristallisation est libérée. cristallisation et la transition vitreuse des polymères semi-cristallins, donnant ainsi un aperçu complet du comportement du matériau pendant le chauffage et le refroidissement. Les effets typiques détectés sont résumés dans les tableaux 2a et 2b.
Tableau 2a : Effets typiques mesurés lors de la CristallisationLa cristallisation est le processus physique de durcissement au cours de la formation et de la croissance des cristaux. Au cours de ce processus, la chaleur de cristallisation est libérée.cristallisation et de la transition vitreuse d'un polymère semi-cristallin à l'aide du DSC 300 Caliris®
1 selon DIN ISO 11357-5:2014
2 selon DIN ISO 11357-2:2014
Tableau 2b : Effets typiques mesurés pendant la CristallisationLa cristallisation est le processus physique de durcissement au cours de la formation et de la croissance des cristaux. Au cours de ce processus, la chaleur de cristallisation est libérée.cristallisation et la transition vitreuse d'un polymère semi-cristallin à l'aide du rhéomètre rotatif Kinexus
| Courbe mesurée | Viscosité de cisaillement complexe | Module de cisaillement élastique G' | Module de cisaillement visqueux G" | Angle de phase δ |
|---|---|---|---|---|
(état fondu) | Dépendance de la température de la rigidité à l'état liquide Aucun effet | G' < G" Les propriétés "liquides" dominent, le polymère s'écoule | >45° : Plus la valeur est faible, plus le polymère fondu est élastique. | |
| Processus de CristallisationLa cristallisation est le processus physique de durcissement au cours de la formation et de la croissance des cristaux. Au cours de ce processus, la chaleur de cristallisation est libérée. cristallisation | Forte augmentation (plus de 3 fois par rapport à la Tg). | Augmentation | Diminution de δ > 45° à δ < 45° | |
| Température de CristallisationLa cristallisation est le processus physique de durcissement au cours de la formation et de la croissance des cristaux. Au cours de ce processus, la chaleur de cristallisation est libérée. cristallisation | Point médian | Point de croisement G'/G" | δ = 45° | |
| Entre Tc et Tg; plateau caoutchouteux | Dépendance de la température de la rigidité dans le plateau caoutchouteux. Pas d'effet. | G' > G" Les propriétés "solid-like" dominent, la phase cristalline donne une structure au polymère, pas d'écoulement. | δ < 45° Plus δ est bas, plus l'échantillon est rigide | |
| Transition vitreuse | Augmentation | Augmentation | Pic : Température de transition vitreuse | Pic : Température de transition vitreuse |
| Après Tg: État solide | Dépendance de la température de la rigidité à l'état solide | - | - | Valeur minimale de δ |