Wprowadzenie
Różnicowa kalorymetria skaningowa (DSC) jest jedną z najczęściej stosowanych metod analizy termicznej w kontroli jakości. Jej ogromna popularność wynika nie tylko z faktu, że dostarcza ona istotnych informacji na temat właściwości materiałów, takich jak zeszklenie, Temperatury i entalpie topnieniaEntalpia syntezy substancji, znana również jako ciepło utajone, jest miarą nakładu energii, zazwyczaj ciepła, która jest niezbędna do przekształcenia substancji ze stanu stałego w ciekły. Temperatura topnienia substancji to temperatura, w której zmienia ona stan ze stałego (krystalicznego) na ciekły (stopiony izotropowo). topnienie lub konwersja kryształ-kryształ, ale także dlatego, że jest łatwa i szybka w użyciu. W szczególności, wszystkie urządzenia NETZSCH DSC oferują możliwość automatyzacji większości etapów pomiarowych, dzięki czemu ocena, a nawet identyfikacja materiału może być przeprowadzona automatycznie.
Eksperymentalny
Wszelkie pomiary DSC polimerów powinny obejmować trzy przebiegi pomiarowe składające się z dwóch pomiarów ogrzewania, pomiędzy którymi próbka jest chłodzona w kontrolowanym tempie. Każda krzywa pomiarowa może dostarczyć różnych informacji o próbce.
- Pierwszy cykl ogrzewania dostarcza informacji o historii termicznej próbki. Na przykład, jak szybko została schłodzona podczas przetwarzania? Jaka była temperatura i wilgotność przechowywania? Czy próbka była poddawana naprężeniom mechanicznym?
- Chłodzenie próbki w określonych warunkach (szybkość chłodzenia, atmosfera) tworzy znaną historię termiczną.
- Późniejsze (drugie) ogrzewanie jest wykorzystywane do określenia właściwości próbki, co jest szczególnie ważne w przypadku konieczności porównania kilku polimerów, na przykład w kontroli jakości.
Poniższe badanie pokazuje jednak, że często pomijany segment chłodzenia może być również bardzo interesujący. Pomiary przeprowadzono na dwóch niewypełnionych próbkach PEEK i zbadano za pomocą DSC. Tabela 1 podsumowuje warunki pomiarów DSC przeprowadzonych na obu próbkach.
Tabela 1: Warunki testowe pomiarów DSC
Próbka 1 | Próbka 2 | |
|---|---|---|
| Urządzenie | DSC 214 Polyma | |
| Masa próbki | 12.05 mg | 5.57 mg |
| Zakres temperatur | 30°C do 400°C (dwukrotnie) | |
| Szybkość ogrzewania i chłodzenia | 10 K/min | |
| Atmosfera | Azot (40 ml/min) | |
| Tygiel | Concavus®(aluminium), zamknięty przebitą pokrywą | |
Wyniki pomiarów
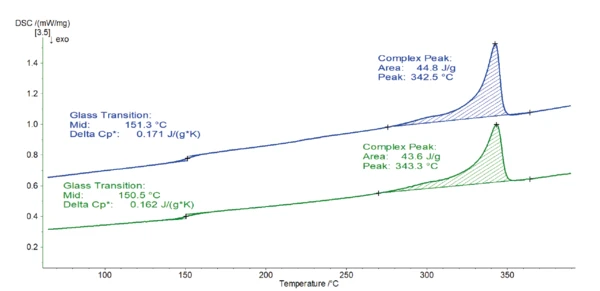
Rysunek 1 przedstawia wyniki drugiego pomiaru ogrzewania, który jest zwykle używany do takiej analizy.
Obie krzywe są bardzo podobne. Etap EndotermicznyPrzemiana próbki lub reakcja jest endotermiczna, jeśli do konwersji potrzebne jest ciepło.endotermiczny wykryty w temperaturze 150-151°C wynika z zeszklenia polimeru. Kolejny pik zlokalizowany między 270°C a 360°C jest spowodowany topnieniem fazy krystalicznej. Dla obu próbek szczytowa temperatura występuje w 343°C i jest związana z entalpią topnienia 44-45 J/g. Ta szczytowa Temperatury i entalpie topnieniaEntalpia syntezy substancji, znana również jako ciepło utajone, jest miarą nakładu energii, zazwyczaj ciepła, która jest niezbędna do przekształcenia substancji ze stanu stałego w ciekły. Temperatura topnienia substancji to temperatura, w której zmienia ona stan ze stałego (krystalicznego) na ciekły (stopiony izotropowo).temperatura topnienia jest typowa dla PEEK [1].
Na podstawie tych krzywych nagrzewania nie ma zauważalnej różnicy między próbkami 1 i 2. Kontrola jakości stwierdziłaby, że jest to ten sam materiał.
Czy to ten sam materiał? Odpowiedź pochodzi z reologii
Więcej informacji na temat tych próbek można uzyskać za pomocą reometrii rotacyjnej. Stopiony polimer jest umieszczany pomiędzy płytkami pomiarowymi reometru rotacyjnego Kinexus. Właściwości lepkosprężyste próbki są określane przez oscylację górnej geometrii z określoną częstotliwością i amplitudą.
Pomiar częstotliwości został przeprowadzony na obu polimerach, upewniając się, że został przeprowadzony w obszarze liniowo-lepkosprężystym (LVR) każdej próbki (patrz ramka informacyjna). Pomiar amplitudy służy jako wstępny pomiar w celu określenia granicy LVR próbki.
Tabela 2 zawiera szczegółowe informacje na temat warunków amplitudy i częstotliwości.
Tabela 2: Warunki testowe pomiarów oscylacji
Przemiatanie amplitudy | Przemiatanie częstotliwości | |
|---|---|---|
| Urządzenie | Kinexus ultra+ z elektrycznie ogrzewaną komorą (EHC) | |
| Geometria | PP25 (płyta-płyta, średnica: 25 mm) | |
| Temperatura | 360°C (powyżej temperatury topnienia) | |
| Odkształcenie ścinające | 1% do 100% | - |
| Naprężenie ścinające | - | 1000 Pa (próbka 1); 500 Pa (próbka 2) |
| Częstotliwość | 1 Hz | 0.01 Hz do 20 Hz |
| Atmosfera | Przepływ azotu (1 l/min) | |
LVR - Liniowy zakres wiskoelastyczny
LVR to zakres amplitudy, w którym odkształcenie i naprężenie są proporcjonalne. W LVR przyłożone naprężenia (lub odkształcenia) są niewystarczające do spowodowania rozpadu strukturalnego, a zatem mierzone są właściwości mikrostrukturalne.
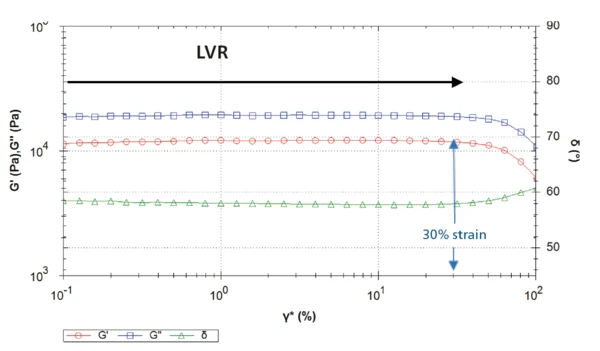
Rysunek 2 przedstawia krzywe wynikające z przemiatania amplitudy na próbce 1. Dla odkształcenia ścinającego do około 30%, Moduł sprężystościModuł zespolony (składnik sprężysty), moduł magazynowania lub G', jest "rzeczywistą" częścią ogólnego modułu zespolonego próbki. Ten składnik sprężysty wskazuje na stałą lub fazową reakcję mierzonej próbki. moduł sprężystości G´ pozostaje stały. Dlatego odkształcenia ścinające powyżej 30% będą destrukcyjne dla tych próbek, ponieważ znajdują się one poza LVR. Odkształcenie ścinające przy 30% odpowiada naprężeniu ścinającemu około 10 000 Pa.
W związku z tym naprężenie ścinające selected wynoszące 1000 Pa dla kolejnych pomiarów oscylacyjnych na tych próbkach, takich jak przemiatanie częstotliwości, mieści się w zakresie LVR, a tym samym nie jest niszczące.
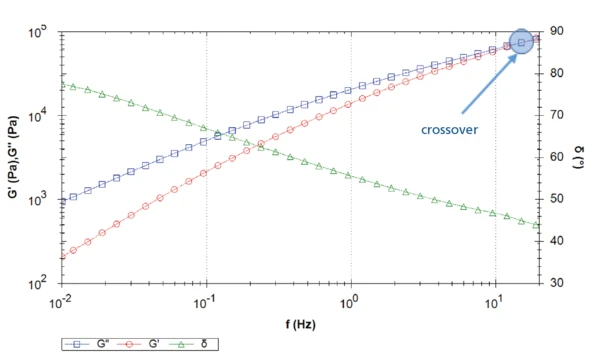
Rysunek 3 przedstawia krzywe sprężystych i stratnych modułów ścinania, a także kąt fazowy zarejestrowany podczas przemiatania częstotliwości. W kierunku niższych częstotliwości Moduł lepkościModuł zespolony (składnik lepkościowy), moduł stratności lub G'' to "urojona" część ogólnego modułu zespolonego próbki. Ten lepki składnik wskazuje na reakcję próbki pomiarowej podobną do cieczy lub poza fazą. moduł lepkości dominuje nad modułem sprężystości (kąt fazowy > 45°): Materiał jest cieczą lepkosprężystą. Skrzyżowanie występuje przy częstotliwości ok. 15 Hz: Przy wyższych częstotliwościach (tj. w krótkich skalach czasowych) dominują "stałe" właściwości materiału.
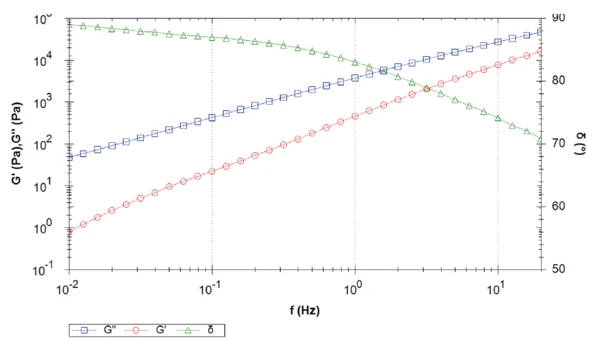
Rysunek 4 przedstawia przemiatanie częstotliwości próbki 2. W całym pomiarze lepki moduł ścinania dominuje nad elastycznym modułem ścinania, co skutkuje kątem fazowym wyższym niż 45°. Kąt fazowy maleje wraz ze wzrostem częstotliwości. Innymi słowy, przy niskich częstotliwościach (lub długich skalach czasowych) w stopie, próbka zachowuje się prawie jak czysta lepka ciecz (kąt fazowy bliski 90°) o minimalnych właściwościach sprężystych.
W tym mierzonym zakresie częstotliwości nie jest wykrywany crossover. Zwrotnica wystąpi przy częstotliwości wyższej niż zmierzony zakres częstotliwości, tj. wyższej niż 20 Hz. Im wyższa częstotliwość zwrotnicy, tym niższa masa cząsteczkowa [2]. Oba materiały najwyraźniej różnią się masą cząsteczkową, czego nie można zaobserwować w przejściach topnienia z DSC.
Rysunek 5 porównuje złożoną lepkość obu próbek. Dla całego zmierzonego zakresu częstotliwości próbka 1 wykazuje wyższą lepkość złożoną niż próbka 2, z różnicą ponad jednej dekady przy 0,1 Hz. Co więcej, próbka PEEK 2 osiąga plateau newtonowskie około 1 Hz. Wręcz przeciwnie, lepkość złożona próbki 1 nadal rośnie wraz ze spadkiem częstotliwości.
Różnica w wartościach złożonego plateau lepkości wynika z różnych mas cząsteczkowych. Im wyższa masa cząsteczkowa, tym wyższe plateau lepkości przy zerowym ścinaniu [2].
Uwaga: W tym przypadku określana jest lepkość złożona, a nie lepkość ścinania. Jednak zgodnie z regułą Coxa-Merza obie wartości mogą być asymilowane [3].
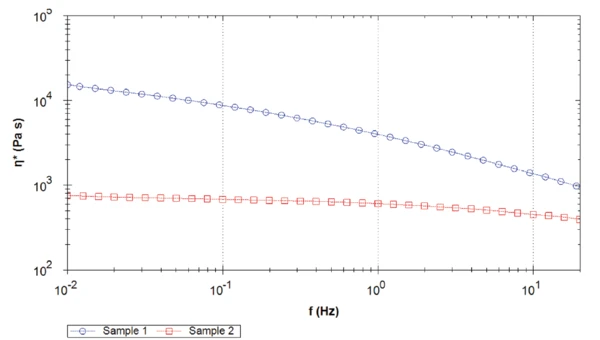
Złożona lepkość, ŋ*, jest uzyskiwana ze złożonej sztywności, G*, i częstotliwości kątowej, ω. ŋ* = G*/ω Jest wyrażana w [Pa-s].
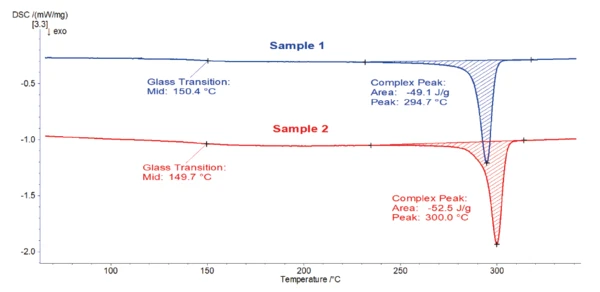
Rysunek 6 przedstawia krzywe chłodzenia DSC obu materiałów PEEK. Pik EgzotermicznyPrzejście próbki lub reakcja jest egzotermiczna, jeśli generowane jest ciepło.egzotermiczny wykryty między 310°C a 240°C pochodzi zazwyczaj z krystalizacji PEEK. Temperatury zeszklenia wykryto około 150°C. Interesującą obserwacją jest różnica w szczytowych temperaturach krystalizacji (Tc), materiał o niższej masie cząsteczkowej (próbka PEEK 2) wykazuje Tco 5°C niższą.
Podczas gdy różnica w masie cząsteczkowej obu polimerów PEEK nie ma wpływu na ich piki topnienia, wykazują one różne zachowania podczas chłodzenia; im niższa masa cząsteczkowa, tym wyższa temperatura krystalizacji. Podczas gdy przebieg chłodzenia w DSC może wskazywać, ale nie przewidywać różnicy w masie cząsteczkowej, pomiar reologiczny wyraźnie dostarcza tych informacji.
Wnioski
Różnicowa kalorymetria skaningowa jest dobrze znaną, łatwą w użyciu techniką, umożliwiającą szybką analizę właściwości termicznych polimerów. Oceny kontroli jakości są zwykle przeprowadzane na drugich krzywych grzania DSC. W niektórych przypadkach segment chłodzenia może mieć również dużą wartość. Reometria jest techniką uzupełniającą, która dostarcza informacji o lepkości i właściwościach lepkosprężystych materiałów. Połączenie zarówno DSC, jak i reometrii zapewnia znacznie głębszy wgląd we właściwości materiału w porównaniu z informacjami dostarczanymi przez jedną metodę.