Introduction
Differential Scanning Calorimetry, DSC, is one of the most frequently used thermal analysis methods for quality control. Its great popularity is not only because it provides substantial information about material properties such as Glass Transition TemperatureThe glass transition is one of the most important properties of amorphous and semi-crystalline materials, e.g., inorganic glasses, amorphous metals, polymers, pharmaceuticals and food ingredients, etc., and describes the temperature region where the mechanical properties of the materials change from hard and brittle to more soft, deformable or rubbery.glass transition, melting or crystal-crystal conversion, but also because it is easy and fast to use. In particular, all NETZSCH DSCs offer the possibility to automate most of the measurement steps, so that evaluation and even the identification of a material can be performed automatically.
Experimental
Any DSC measurements on polymers should include three measurement runs consisting of two heating measurements, between which the sample is cooled at a controlled rate. Each measurement curve can provide different insights and information about the sample.
- The first heating run provides information about the thermal history of the sample. For example, how rapidly was it cooled during processing? What were the storage temperature and humidity conditions? Has it been subjected to mechanical StressStress is defined as a level of force applied on a sample with a well-defined cross section. (Stress = force/area). Samples having a circular or rectangular cross section can be compressed or stretched. Elastic materials like rubber can be stretched up to 5 to 10 times their original length.stress?
- Cooling the sample under defined conditions (cooling rate, atmosphere), a known thermal history is created.
- The subsequent (second) heating is used for determination of the sample´s properties, particularly important if several polymers have to be compared, for example in quality control.
However, the following study shows that the often overlooked cooling segment can also be of great interest. Measurements were conducted on two unfilled PEEK samples and investigated by means of DSC. Table 1 summarizes the conditions of the DSC measurements performed on both samples.
Table 1: Test condition of the DSC measurements
Sample 1 | Sample 2 | |
|---|---|---|
| Device | DSC 214 Polyma | |
| Sample mass | 12.05 mg | 5.57 mg |
| Temperature range | 30°C to 400°C (twice) | |
| Heating and cooling rates | 10 K/min | |
| Atmosphere | Nitrogen (40 ml/min) | |
| Crucible | Concavus®(aluminum), closed with pierced lid | |
Measurement Results
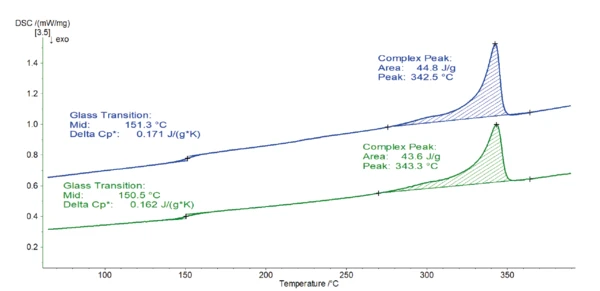
Figure 1 displays the results from the second heating measurement run normally used for such an analysis.
Both curves are very similar. The EndothermicA sample transition or a reaction is endothermic if heat is needed for the conversion.endothermic step detected at 150-151°C results from the Glass Transition TemperatureThe glass transition is one of the most important properties of amorphous and semi-crystalline materials, e.g., inorganic glasses, amorphous metals, polymers, pharmaceuticals and food ingredients, etc., and describes the temperature region where the mechanical properties of the materials change from hard and brittle to more soft, deformable or rubbery.glass transition of the polymer. The subsequent peak located between 270°C and 360°C is due to melting of the crystalline phase. For both samples, the peak temperature is found at 343°C and is associated with a melting enthalpy of 44-45 J/g. This melting peak temperature is typical for PEEK [1].
Based on these heating curves, there is no noticeable difference between samples 1 and 2. Quality control would conclude that it is the same material.
Is it the Same Material? The Answer Comes from Rheology
More information about these samples can be obtained by rotational rheometry. The polymer melt is placed between the measurement plates of the Kinexus rotational rheometer. The viscoelastic properties of the sample are determined by oscillation of the upper geometry at a specified frequency and amplitude.
A frequency sweep measurement was conducted on both polymers, ensuring it was carried out within the linear-viscoelastic region (LVR) of each sample (see info box). An amplitude sweep serves as a preliminary measurement to determine the limit of the sample’s LVR.
Table 2 details the conditions of the amplitude and of the frequency sweeps.
Table 2: Test condition of the oscillation measurements
Amplitude Sweep | Frequency Sweep | |
|---|---|---|
| Device | Kinexus ultra+ with electrically heated chamber (EHC) | |
| Geometry | PP25 (plate-plate, diameter: 25 mm) | |
| Temperature | ||
| Shear StrainStrain describes a deformation of a material, which is loaded mechanically by an external force or stress. Rubber compounds show creep properties, if a static load is applied.strain | 1% to 100% | - |
| Shear StressStress is defined as a level of force applied on a sample with a well-defined cross section. (Stress = force/area). Samples having a circular or rectangular cross section can be compressed or stretched. Elastic materials like rubber can be stretched up to 5 to 10 times their original length.stress | - | 1000 Pa (sample 1); 500 Pa (sample 2) |
| Frequency | 1 Hz | 0.01 Hz to 20 Hz |
| Atmosphere | Nitrogen flow ( 1 l/min) | |
LVR – Linear Visco-Elastic Range
The LVR is the amplitude range where StrainStrain describes a deformation of a material, which is loaded mechanically by an external force or stress. Rubber compounds show creep properties, if a static load is applied.strain and StressStress is defined as a level of force applied on a sample with a well-defined cross section. (Stress = force/area). Samples having a circular or rectangular cross section can be compressed or stretched. Elastic materials like rubber can be stretched up to 5 to 10 times their original length.stress are proportional. In the LVR, the applied stresses (or strains) are insufficient to cause structural breakdown and hence, microstructural properties are being measured.
Figure 2 depicts the curves resulting from the amplitude sweep on sample 1. For shear StrainStrain describes a deformation of a material, which is loaded mechanically by an external force or stress. Rubber compounds show creep properties, if a static load is applied.strain up to approximately 30%, the elastic shear modulus G´ remains constant. Therefore, shear strains above 30% will be destructive to these samples as they are outside of the LVR. The shear StrainStrain describes a deformation of a material, which is loaded mechanically by an external force or stress. Rubber compounds show creep properties, if a static load is applied.strain at 30% corresponds to a shear StressStress is defined as a level of force applied on a sample with a well-defined cross section. (Stress = force/area). Samples having a circular or rectangular cross section can be compressed or stretched. Elastic materials like rubber can be stretched up to 5 to 10 times their original length.stress of approx. 10,000 Pa.
Therefore, a selected shear StressStress is defined as a level of force applied on a sample with a well-defined cross section. (Stress = force/area). Samples having a circular or rectangular cross section can be compressed or stretched. Elastic materials like rubber can be stretched up to 5 to 10 times their original length.stress of 1,000 Pa for subsequent oscillatory measurements on these samples, such as a frequency sweep, is within the LVR and thereby non-destructive.
Figure 3 depicts the curves of the elastic and loss shear moduli in addition to the phase angle captured during the frequency sweep. In the direction of lower frequencies, the Viscous modulusThe complex modulus (viscous component), loss modulus, or G’’, is the “imaginary” part of the samples the overall complex modulus. This viscous component indicates the liquid like, or out of phase, response of the sample being measurement. viscous modulus dominates the Elastic modulusThe complex modulus (elastic component), storage modulus, or G’, is the “real” part of the samples the overall complex modulus. This elastic component indicates the solid like, or in phase, response of the sample being measurement. elastic modulus (phase angle > 45°): The material is a viscoelastic liquid. A crossover is found at a frequency of approx.15 Hz: For higher frequencies (i.e., short-time scales), the “solidlike” properties of the material dominate the behavior.
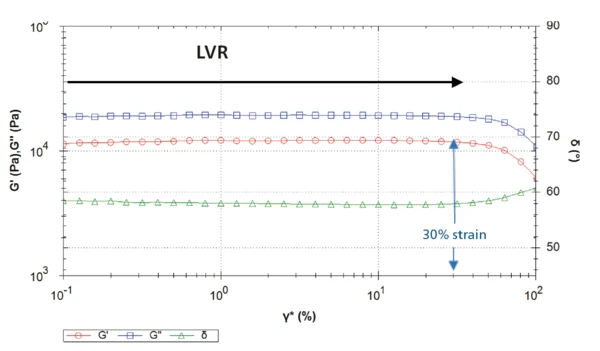
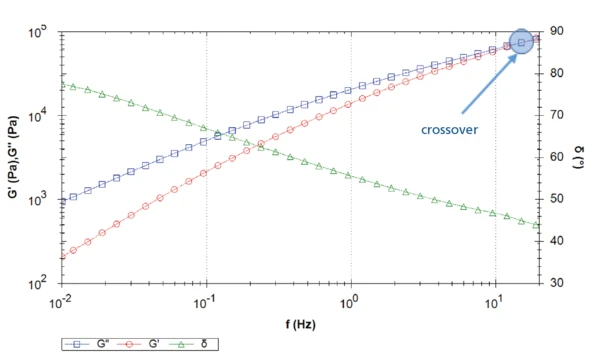
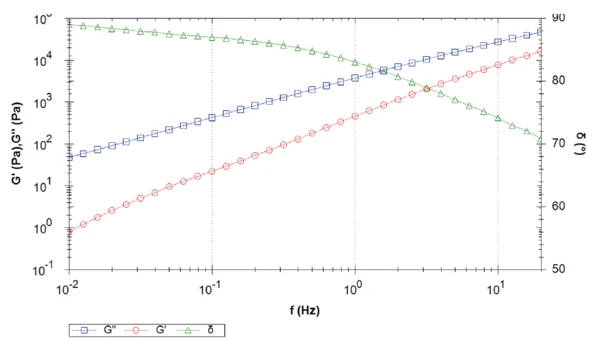
Figure 4 displays the frequency sweep of sample 2. Over the entire measurement, the viscous shear modulus dominates the elastic shear modulus, which results in a phase angle higher than 45°. Phase angle decreases with increasing frequency. In other words, at low frequencies (or long-time scales) in the melt, the sample behaves almost like a pure viscous fluid (phase angle close to 90°) with minimal elastic properties.
In this measured frequency range, no crossover is detected. The crossover will occur at a frequency higher than the measured frequency range, i.e., higher than 20 Hz. The higher the frequency of the crossover, the lower the molecular weight [2]. Both materials apparently differ in their molecular weight, which could not be observed in the melting transitions from DSC.
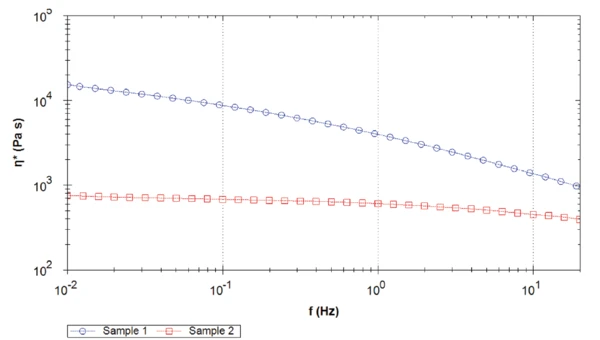
Figure 5 compares the complex viscosity of both samples. For the complete measured frequency range, sample 1 shows a higher complex viscosity than sample 2, with more than one decade difference at 0.1 Hz. Moreover, the PEEK sample 2 reaches a Newtonian plateau around 1 Hz. On the contrary, the complex viscosity of sample 1 continues increasing with decreasing frequencies.
The difference in the values of the complex viscosity plateau is due to the different molecular weights. The higher the molecular weight, the higher the zero shear viscosity plateau [2].
Note: Here, the complex viscosity and not the shear viscosity, is determined. However, according to the Cox-Merz rule, both values can be assimilated [3].
The complex viscosity, ŋ*, is obtained from the complex stiffness, G*, and the angular frequency, ω. ŋ* = G*/ω It is expressed in [Pa·s].
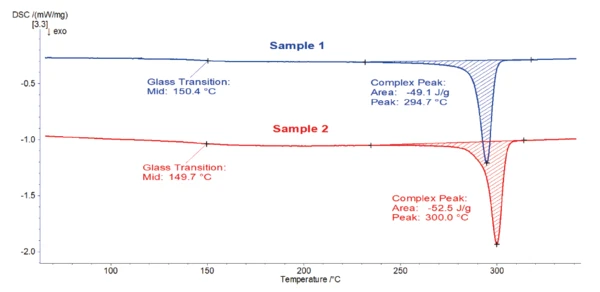
Figure 6 depicts the DSC cooling curves of both PEEK materials. The ExothermicA sample transition or a reaction is exothermic if heat is generated.exothermic peak detected between 310°C and 240°C come typically from the CrystallizationCrystallization is the physical process of hardening during the formation and growth of crystals. During this process, heat of crystallization is released.crystallization of PEEK. The Glass Transition TemperatureThe glass transition is one of the most important properties of amorphous and semi-crystalline materials, e.g., inorganic glasses, amorphous metals, polymers, pharmaceuticals and food ingredients, etc., and describes the temperature region where the mechanical properties of the materials change from hard and brittle to more soft, deformable or rubbery.glass transition temperatures were detected around 150°C. An interesting observation is the difference in peak CrystallizationCrystallization is the physical process of hardening during the formation and growth of crystals. During this process, heat of crystallization is released.crystallization temperatures (Tc), the material with lower molecular weight (PEEK sample 2) exhibits a Tc 5°C lower.
While the difference in the molecular weight of both PEEK polymers has no influence on their melting peaks, they exhibit different cooling behaviors; the lower the molecular weight, the higher the CrystallizationCrystallization is the physical process of hardening during the formation and growth of crystals. During this process, heat of crystallization is released.crystallization temperature. While the cooling run in the DSC can indicate, but alone not predict the difference in molecular weight, the rheology measurement clearly provides this information.
Conclusion
Differential scanning calorimetry is a well-known, easyto- use technique, enabling fast analysis of thermal properties of polymers. Quality control assessments are typically performed on the second DSC heating curves. In some cases, the cooling segment can also be of great value. Rheometry is a complementary technique that provides information about the viscosity and the viscoelastic properties of materials. The combination of both DSC and rheometry provides a much deeper insight into the material's properties compared to the information one single method would deliver.