
16.09.2020 von Dr. Alexander Schindler
Detection of Ultra-Small Residual Masses: Weigh The Little Bird!
Thermogravimetry (TGA) is frequently applied for the compositional analyses of such materials as, for example, fiber-reinforced polymer composites. The residual mass at the end of a TGA experiment reflects the filler or glass fiber content as well as the presence of impurities. By using a relatively large sample volume in a top-performing thermobalance along with the intelligent Proteus®® software by NETZSCH, it is possible to detect ultra-small residual masses with concentrations down to the ppm (= 10-6) range! Such small concentrations can be illustrated by a little bird with a mass of a few grams sitting on the back of an elephant weighing a few tons.
While the detection of residual masses in the percent or sub-percent range is currently state of the art, it is much more challenging to identify and quantify residual masses in the ppm range. The most important prerequisite is a thermobalance with top performance: The STA 449 F1 Jupiter® by NETZSCH (see figure 1) offers a dynamic weighing range with a maximum sample load of 5 grams, which can be fully utilized using a 5 cm3 beaker crucible. On the other hand, the resolution and the balance drift per hour is around 1 microgram.
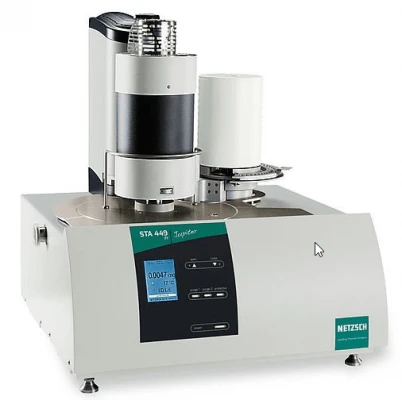
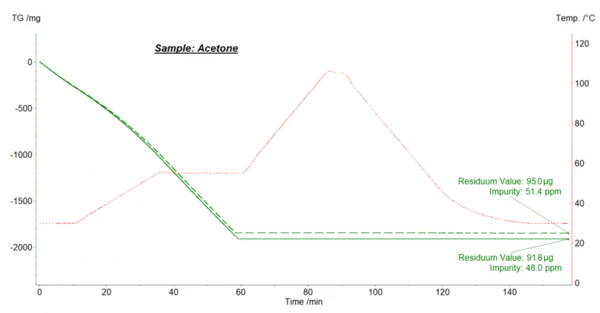
Figure 2 depicts exemplary measurement results obtained for commercially available acetone solvent. In this experiment, the residual masses (“residuum values”) can be viewed as distillation residue and reflect the non-evaporating impurities. From the residuum values of 95 µg and 92 µg measured directly and automatically at the end of the final isothermal phase at 30°C, and the initial sample masses of 1848 mg and 1913 mg determined automatically at the start of the measurements, mass concentrations of 51 ppm and 48 ppm were calculated by the Proteus® analysis software. It should be emphasized that Proteus® analysis also works within the framework of the CFR21-part-11-conform software Proteus®Protect. The method shown in figure 2 was applied extensively by J. Wiss et al. for various solvents in order to validate the cleaning of the equipment of pharmaceutical production plants; it was possible to reliably detect impurity concentrations in the range between about 5 and 50 ppm [1].
The content of this article is available in more detail as an Application Note and furthermore as a video of a presentation:
[1] J. Wiss, J.-L. Schmuck, Cleaning validation using thermogravimetry, Journal of Thermal Analysis and Calorimetry, DOI 10.10007/s10973-010-1144-7