Introduction
Nylon ties are produced by injection molding using ULapproved PA66 (Nylon 66). Due to its good acid resistance, corrosion resistance, isolation and mechanical properties, and aging stability, nylon ties are widely used in electronic and electrical appliances, wires and cables, lamps and lanterns, machinery and equipment, shipbuilding, construction, and other industries.
Breaking strength is one of the most important performance indicators of nylon ties, whether the fracture occurs in the end part, center, or reverse teeth, the fracture strength should be higher than the nominal value of the tension strength. When the fracture strength is less than the nominal value, one of the solutions is to replace the current tie with another product with higher tension strength. However, the possible reasons for failure of the nylon tie should be considered, e.g., high temperature and long storage time results in aging and embrittlement. But also, the loss of moisture will significantly influence the mechanical properties. A fundamental cause can always be replacement of the original material with low-cost raw materials or the usage of recycled materials. Last but not least, the processing conditions have important influence on the final quality of the ties.
Sample Preparation and Measurement Conditions
In this application note, the causes of breakage were analyzed by the DSC method; the details are as follows: There are 3 nylon tie samples, which are sample #1 OK, sample #2 stock, and sample #3 NOK (broken in the middle), as shown in figure 1. The measurement conditions are detailed in table 1.

Table 1: Parameters for DSC measurements
| Sample | Sample #1 OK | Sample #2 Stock | Sample #3 NOK |
|---|---|---|---|
| Sample mass [mg] | 9.48 | 9.03 | 9.04 |
| Crucible | Concavus® Al crucibles, pierced lid | ||
| Temperature program | -50°C ... 300°C | ||
| Heating/cooling rate | 20 K/min | ||
| Atmosphere | Nitrogen (20 ml/min) | ||
Measurement Results
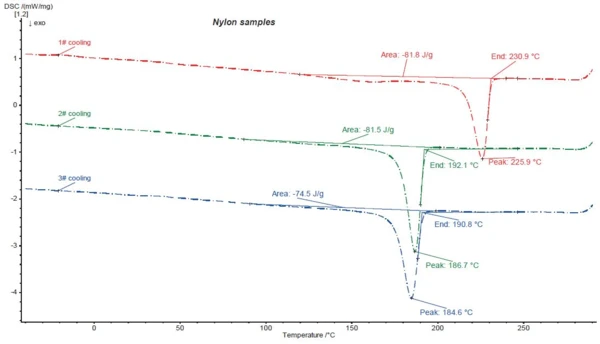
For comparison of the differences of the three samples, the heating curves and cooling curves are shown in figures 2 and 3, respectively. Sample #1, sample #2 and sample #3 are presented in red, green and blue.
According to the results of the1st heating, the Melting Temperatures and EnthalpiesThe enthalpy of fusion of a substance, also known as latent heat, is a measure of the energy input, typically heat, which is necessary to convert a substance from solid to liquid state. The melting point of a substance is the temperature at which it changes state from solid (crystalline) to liquid (isotropic melt).melting temperature (peak 261.9°C) of sample #1 is in the range of the theoretical Melting Temperatures and EnthalpiesThe enthalpy of fusion of a substance, also known as latent heat, is a measure of the energy input, typically heat, which is necessary to convert a substance from solid to liquid state. The melting point of a substance is the temperature at which it changes state from solid (crystalline) to liquid (isotropic melt).melting temperature of PA66 (225°C to 265°C). The Melting Temperatures and EnthalpiesThe enthalpy of fusion of a substance, also known as latent heat, is a measure of the energy input, typically heat, which is necessary to convert a substance from solid to liquid state. The melting point of a substance is the temperature at which it changes state from solid (crystalline) to liquid (isotropic melt).melting temperature ranges of samples #2 and #3 are quite similar, although the shapes of the peaks are different. The shape of the first heating curve is influenced by the thermomechanical history (such as processing conditions but also sample preparation), and therefore, this will not be discussed further.
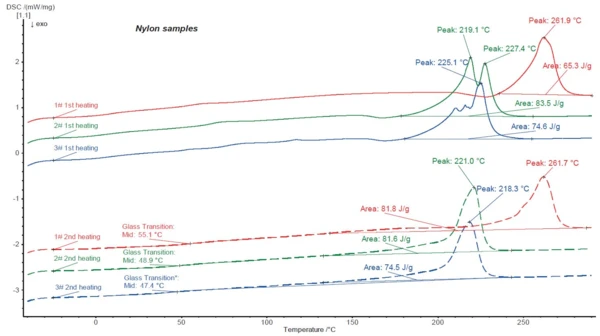
For direct comparison of the material, it is better to compare the2nd heating curves, as the thermal history of all samples is now exactly the same. The melting peaks of samples #2 and #3 are quite similar, which means the compositions of sample #2 and sample #3 are most likely the same. Sample #1 shows completely different melting behavior. It’s therefore supposed that sample #1 must be made from a different material.
The cooling curves show that the CrystallizationCrystallization is the physical process of hardening during the formation and growth of crystals. During this process, heat of crystallization is released.crystallization temperature of sample #1 (peak 225.9°C) is higher than that of the other 2 samples, and the CrystallizationCrystallization is the physical process of hardening during the formation and growth of crystals. During this process, heat of crystallization is released.crystallization temperatures of samples #2 and #3 are similar.
Combining the results of the2nd heating and cooling, it can be presumed that sample #1 is likely PA66. The material of samples #2 and #3 is quite similar and it may be another type of polyamide.
To identify the material of samples #2 and #3, the Identify function of the Proteus® software was used. The similarity between the 2nd heating curve of the #2 sample and PA610 reaches 98.92% (the green curve in figure 4 is the2nd heating curve of the #2 sample, and the red curve is the standard curve of PA610 in the database), which indicates that the material of the #2 and #3 samples is likely PA610.
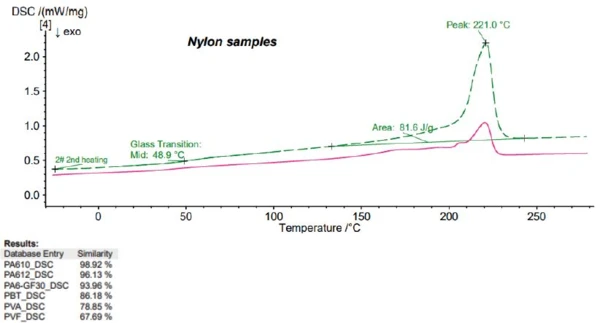
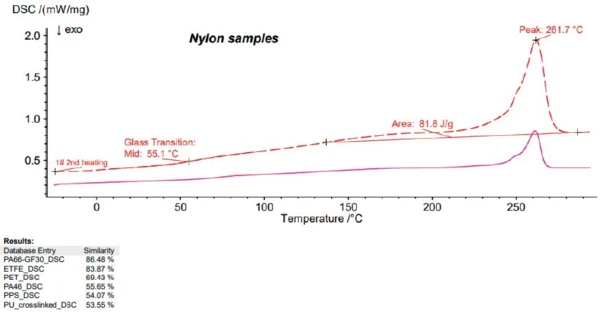
Figure 5 shows the Identify result of the2nd heating curve of sample #1; the similarity between sample #1 and PA66 in the KIMW database* is almost 90%, which confirms the previous assumption.
*KIMW database for DSC measurements on polymers, a collaboration with Kunststoffinstitut Lüdenscheid, Germany
Summary
According to the results of Identify, sample #1 OK is made of PA66, but sample #2 stock and sample # 3 NOK are made of PA610. The mechanical properties of PA66 and PA610 are different, and the melting and CrystallizationCrystallization is the physical process of hardening during the formation and growth of crystals. During this process, heat of crystallization is released.crystallization behavior is not the same, even if they were processed with the same method; one of them might be overheated or degraded, which may influence the performance of the products – for example, it may easily fracture.