はじめに
Identify DSC曲線認識およびデータベースシステムは、未知試料の同定や品質管理のための斬新で強力なソフトウェアツールです。DSCの一般的な問題として、DSC曲線が試料質量と加熱速度に依存することが挙げられます。試料質量と加熱速度の値が高いほど、ガラス転移や融解ピークのような熱量効果が高温にシフトする傾向があります。この研究の目的は、Identify 検索結果がこのような温度シフトによってどのような影響を受けるかを調べることである。
一般的な例
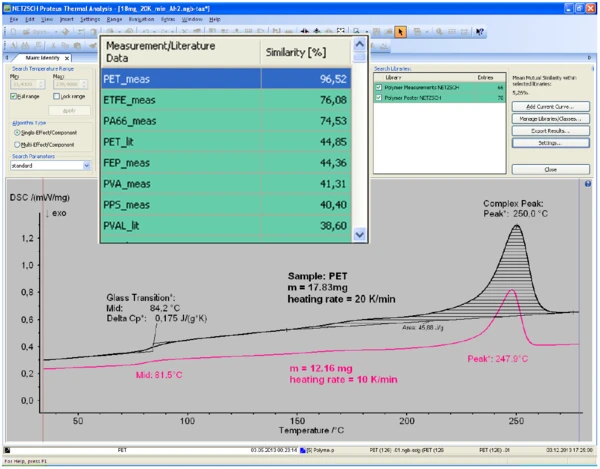
図1は、17.83 mgのPET試料を加熱速度20 K/分(10 K/分で冷却後、2回目の加熱)で測定したIdentify 。データベース曲線は、異なるPET試料質量(12.16 mg)に対して異なる加熱速度(10 K/分)で測定されたにもかかわらず、DSC曲線はPETのものとして正しく同定されました。明らかに、測定条件の違いによるガラス転移温度と融解ピーク温度のシフトは、検索結果にはわずかな影響しか与えませんでした。両曲線の類似度は96.5%で、ほぼ完全に一致しました!
系統的研究
HDPEについて、「試料質量」と「加熱速度」の測定条件がDSC曲線、ひいてはIdentify の結果に及ぼす影響を系統的に調べた。質量1, 5, 10, 15, 20 mgの5種類のHDPE試料を、2回の加熱サイクルにわたって室温から200℃まで10 K/分の速度で加熱した。
図2は、2回目の加熱曲線の融解ピークが、試料質量が大きくなるにつれて高温側にシフトし、幅が広くなっていることを示しています。10mgの試料で得られた曲線を基準として考えると、この曲線と1、5、15、20mgの曲線との間に高い類似値が観察される(図2の表参照)。Identify の場合、5mg、10mg、15mgの試料で得られた曲線は、類似度が99%以上であるため、ほぼ同一である。類似度が92%以上の1-mgと20-mgの試料の曲線も、おそらく正しく認識されるであろう。
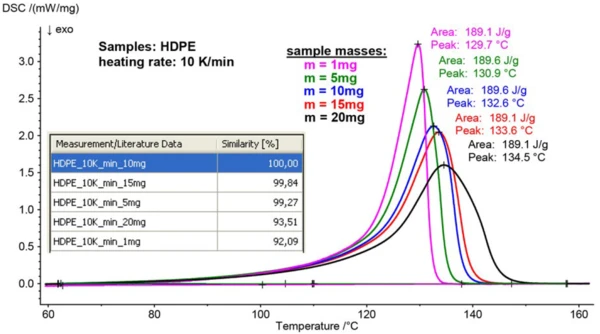
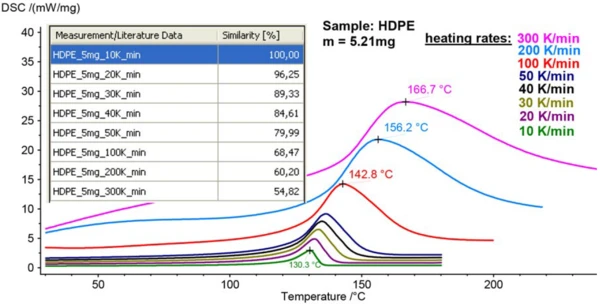
図3は、質量5.21mgの同じHDPE試料の融解ピークに対する加熱速度の違いの影響を示している。加熱速度が10 K/分から300 K/分に増加するにつれて、ピーク温度は130.3℃から166.7℃にシフトし、ピークは再び大きく広がった。
図3の表は、10K/minで得られた曲線(基準)と他のすべてのデータセットとの間のIdentify 、類似度の値をそれぞれ示している。10K/分で測定した曲線と20K/分で測定した曲線の類似度は96.3%と高かった。類似度の値は、加熱速度が2倍になるごとに約10%減少した。
結びの言葉
- Identify 、同じ試料のDSC曲線を確実に一致させることができることが実証され、試料の測定条件が大きく異なる場合でも高い類似度が得られました。標準的な」検索パラメータを使用した場合、試料の質量や加熱速度が2倍異なっても、非常に高い類似度が得られるため、おそらく試料を正しく識別できます。
- 試料をより区別したい品質管理目的では、Identify の「標準」検索パラメータではなく「要求」検索パラメータを選択することで、DSC曲線のわずかな違いを識別することができ、これにより類似性値にlarge のばらつきが生じます。
- 異なる測定条件で測定されたDSC曲線は、すべてIdentify のユーザーライブラリに追加することができ、その結果、将来的に認識されるようになります。Identify では、異なる試料質量または加熱速度で測定されたDSC曲線をクラス(材料クラス「HDPE」など)にまとめることもできます。この機能により、測定条件とは無関係に試料を正しく識別できる可能性も高まります。