Introduction
Whether the long-term stability of an emulsion or suspension is governed by a zero shear viscosity or a Yield StressYield stress is defined as the stress below which no flow occurs; literally behaves like a weak solid at rest and a liquid when yielded.yield stress is dependent upon its microstructure. Furthermore, it is the state of this microstructure at long timescales that is important since this is ultimately what any dispersed phase will encounter over prolonged storage. One way to determine the existence, and if so magnitude of this low shear (zero shear) viscosity is from a creep test. This test involves applying a constant stress over a prolonged timescale and monitoring the resultant strain or compliance (strain/stress) as a function of time.
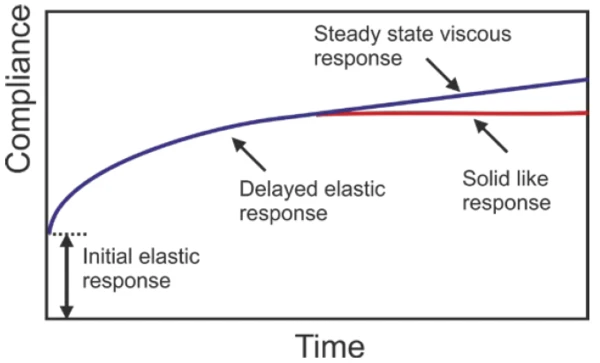
As shown in Figure 1, a purely viscous material will show a constant increase in compliance with time indicative of flow, i.e., steady state viscous response. In contrast, a solid will show a zero gradient indicating an elastic response.

For viscoelastic materials, the response will be a combination of viscous and elastic effects as shown in Figure 2, with the response at long times indicating whether it has a Yield StressYield stress is defined as the stress below which no flow occurs; literally behaves like a weak solid at rest and a liquid when yielded.yield stress (elastic) or a steady state viscous response (viscous). If the material shows a steady-state viscous response, then the zero shear viscosity is simply given by the inverse gradient of the compliance versus time plot.

If the average particle size, density and volume fraction of the dispersed phase are known, and the zero shear viscosity of the continuous phase is determined, then the velocity (V) of the dispersed phase can be estimated using the following modification of Stokes equation:

Potentially, the dispersion can then be re-formulated to obtain a low shear viscosity sufficient to suspend the dispersed phase for the required period, or alternatively to introduce a Yield StressYield stress is defined as the stress below which no flow occurs; literally behaves like a weak solid at rest and a liquid when yielded.yield stress which would give a solid-like response at long times.
It is important when running a creep test that sufficient time is allowed for steady state to be reached. If not, then too low a value of the zero shear viscosity may be reported or indeed an incorrect assumption is made that the material has a zero shear viscosity when it actually has a Yield StressYield stress is defined as the stress below which no flow occurs; literally behaves like a weak solid at rest and a liquid when yielded.yield stress. Since dispersions may sit on a shelf undisturbed for weeks or even months at a time, then this needs to be considered in any test protocol.
This application note shows methodology and data from creep testing for two commercial shower gel products.
Experimental
- Two commercial shower gel products were evaluated; one containing surfactant only and the other containing surfactant and an associative thickener.
- Rotational rheometer measurements were made using a Kinexus rheometer with a Peltier plate cartridge and a cone and plate measuring system1, and utilizing standard pre-configured sequences in rSpace software.
- A standard loading sequence was used to ensure that the samples were subject to a consistent and controllable loading protocol.
- All rheology measurements were performed at 25°C unless specifically stated.
- A stress-controlled amplitude sweep is performed to measure the length of the Linear ViscoElastic Region (Linear Viscoelastic Region (LVER)In the LVER, applied stresses are insufficient to cause structural breakdown (yielding) of the structure and hence important micro-structural properties are being measured.LVER), and to determine an appropriate stress value to be used in the subsequent creep test (the Linear Viscoelastic Region (LVER)In the LVER, applied stresses are insufficient to cause structural breakdown (yielding) of the structure and hence important micro-structural properties are being measured.LVER determination is automated within rSpace software, and the stress value determined is fed forward into the next part of the sequence).
- A creep test is performed at the pre-determined stress value within the Linear Viscoelastic Region (LVER)In the LVER, applied stresses are insufficient to cause structural breakdown (yielding) of the structure and hence important micro-structural properties are being measured.LVER − with the achievement of steady state set as the end condition (within defined tolerance conditions).
- Data analysis is performed using the action ´Zero shear viscosity from creep data`
- A Stokes Law calculator in the software then estimates the sedimentation velocity of the particles, based on the measured viscosity and user-inputted variables for the particle characteristics.
Results and Discussion
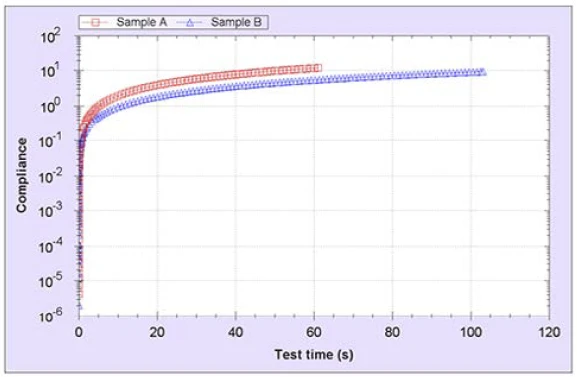
Figure 3 shows the creep response for the two shower gel products on a logarithmic scale. Clearly the two products show a similar initial elastic response, however, there are differences in the delayed elastic response as indicated by the timescale required to achieve steady state. The steady state tolerance range employed in this test was within ± 1% for 60 seconds. Clearly sample A displays steady state behavior almost immediately, while Sample B has some residual elasticity.

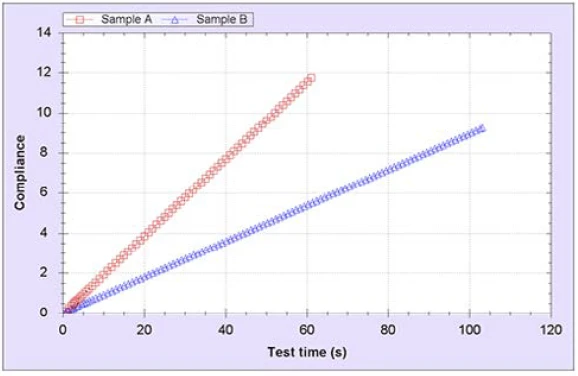
Figure 4 shows the same plot but using a linear scale. This makes it easier to distinguish the differences in the gradient of the compliance versus time plots. Since η0 is given by the inverse gradient of the steady state portion of the curve then it is clear that sample B will have a higher zero shear viscosity than sample A. These values were automatically calculated as part of the test and were found to be 6 Pas and 12 Pas for sample A and B, respectively. According to Equation 1, this means that sample B would reduce the rate of sedimentation by a factor of 2 for suspensions of equivalent particles and volume fractions. Whether these viscosity values are sufficient to give effective stability will depend on the specific size, density and volume of the dispersed phase, which need to be determined using independent techniques.

Conclusions
Creep testing is an effective means of determining the zero shear viscosity of a material and can be used to assess suspension stability.
In this test, it has been shown that a small amount of an associative thickener can double the zero shear viscosity of a surfactant-based shower gel and reduce the rate of sedimentation by a factor of two (for suspensions of equivalent particles and volume fractions).
1Please note that a parallel plate geometry or a cylindrical geo-metry can also be used. The use of a solvent trap is also recommended for these tests since evaporation of solvent (e.g., water) around the edges of the measuring system can invalidate the test, particularly when working at higher temperatures.