Introduction
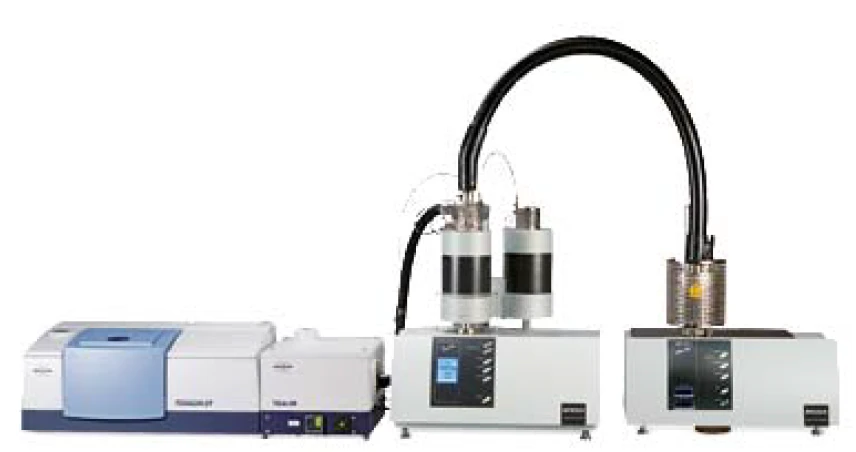
Zinc oxide (ZnO) nanoparticles are being investigated for the synthesis of materials with tunable magnetic and electric properties and for possible medical applications in cancer therapy. In this study, a sample of thiol-capped ZnO nanoparticles was studied by simultaneous TGA-DSC (STA) using a NETZSCH STA 449 F1 Jupiter® thermal analyzer which was coupled to both a NETZSCH QMS 403 Aëolos® mass spectrometer and a BRUKER Optics TENSOR™ FT-IR spectrometer (Figure 1) to perform evolved gas analysis by QMS and FT-IR. The transfer lines, the coupling adapters and the FT-IR gas cell were kept at a constant temperature of 200°C.
Measurement Results
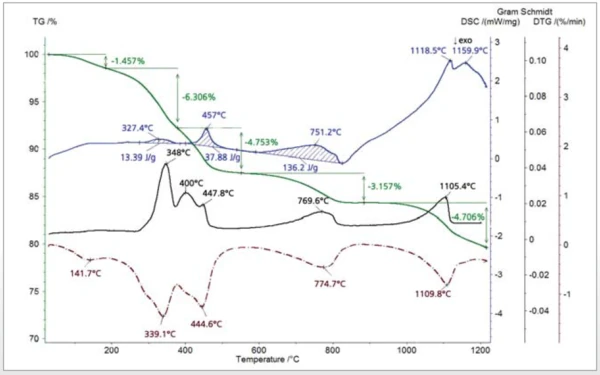
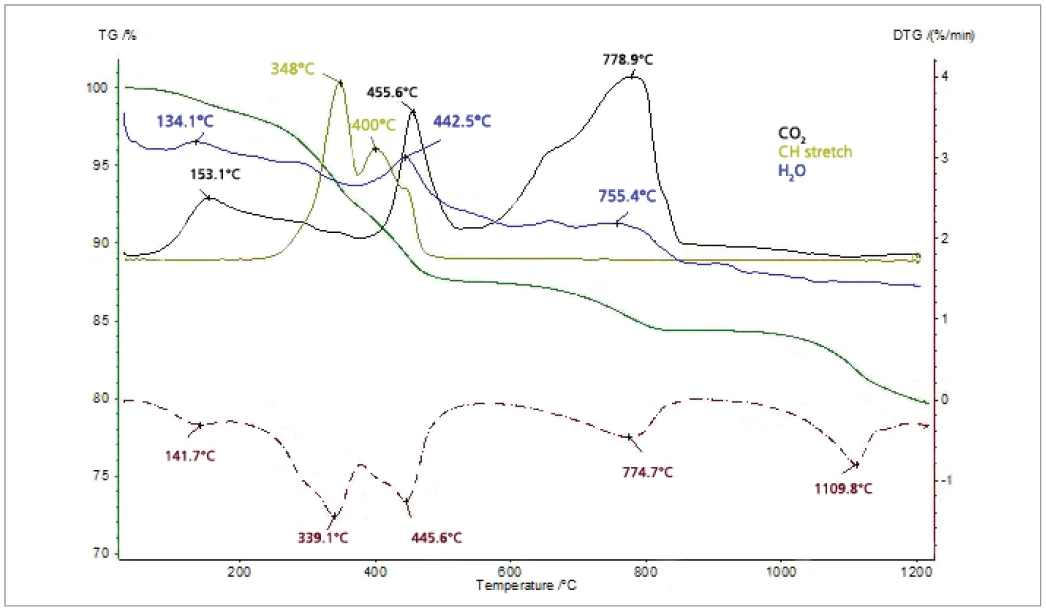
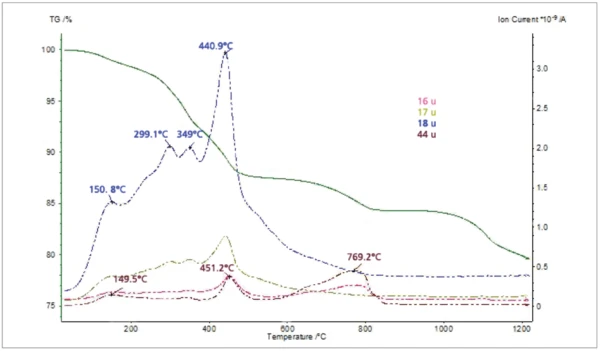
The thiol-capped ZnO nanoparticles sample with a mass of 11.18 mg was pressed on the bottom of a Pt-Rh DSC crucible to form a layer of about 1 mm thickness and was heated from 30°C to 1200°C at a heating rate of 20 K/min under 60 ml/min nitrogen purge. The TGA, DTG (mass change rate), DSC and Gram Schmidt (total integral of the IR absorption) curves are plotted in Figure 2. The TGA curve shows five mass-loss steps which have corresponding peaks in the DTG curve and corresponding endothermic features in the DSC curve due to desorption and decomposition processes in the sample. Apart from the very small effect below 200°C, the peak temperatures in the Gram Schmidt plot correspond well with the peak temperatures in the DTG curve. The TGA and DTG curves along with the temperature-dependent integrated band areas (traces) for the O-H stretching of H2O, the C-H stretching of hydrocarbons and the anti-symmetric C=O stretching of CO2 are plotted in Figure 3. As can be clearly seen, desorption of H2O and CO2 corresponds with the first four mass-loss steps whereas the hydrocarbons evolve in the midtemperature range in good correspondence with the second and third mass loss steps in the TGA curve. The MS ion-current curves for H2O (18; 17 and partially 16 u*) and CO2 (44 and partially 16 u) plotted in Figure 4 together with the TGA curve show more details due to the higher sensitivity of the MS, but the results are in agreement with the FT-IR traces that H2O and CO2 evolution corresponds with the first four mass-loss steps in the TGA curve.
*”u” unifi ed atomic mass unit, dated “amu”
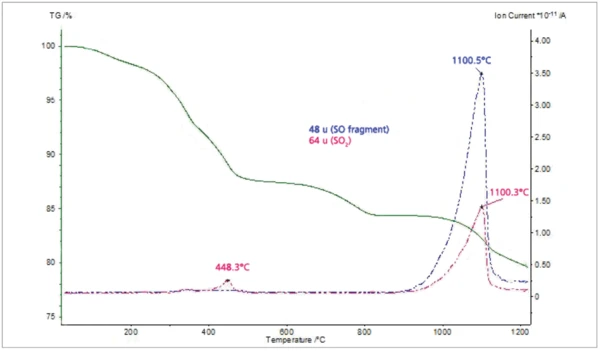
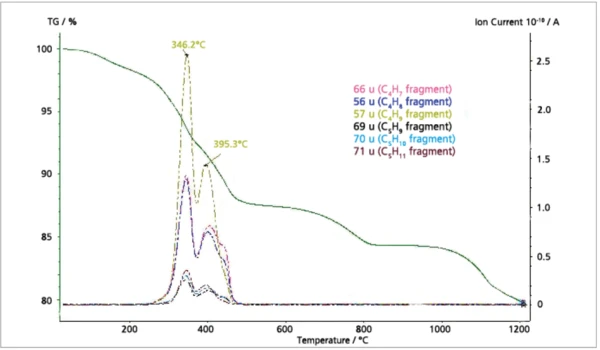
The MS ion-current curves for SO2 (64; 48 amu) plotted in Figure 5 along with the TGA curve clearly show that small amounts of SO2 evolve at elevated temperatures in correspondence with the fifth mass loss step in the TGA curve. Finally, the MS ioncurrent curves for many different organic fragments plotted in Figure 6 show that these species evolve as two peaks in very good agreement with the FT-IR results.
Conclusion
A simultaneous TGA/DSC (STA) instrument coupled to MS and FT-IR spectrometers is a very powerful combination for sample characterization because it supplies data for the mass change (TGA), transformation temperatures and energetics (DSC) and evolved gas analysis (MS, FT-IR) in a single measurement. All the data analysis is carried out with the NETZSCH Proteus® software.
Simultaneous use of MS and FT-IR for evolved gas analysis is very benefi cial because the FT-IR can quickly identify functional groups based on their characteristic bands, but on the other hand, the MS has higher sensitivity and it can also detect homonuclear diatomic molecules (H2, O2, N2) and atomic gases (He, Ne, Ar, etc.) which are not detectable by FT-IR.