Introduction
Making shear rheological measurements on samples with a high solids fraction can present difficulties on a rotational rheometer, since the sample can be prone to fracture even at low to medium shear rates. When this occurs, a sudden, sharp decrease in shear stress is seen in the data when the sample fractures at the edge of the geometry gap.
An example of a concentrated suspension prone to such effects is toothpaste. Toothpastes generally comprise of an abrasive, a polymeric thickener and a dispersant in an aqueous base, together with flavorings and preservatives. Such highly packed materials typically show fracture under rotational shear, which can be problematic when assessing the performance under conditions that are relevant to the application. In the case of toothpastes, it can be difficult to determine flow characteristics relevant to processing, and it is often difficult to predict how the finished toothpaste will flow out of the tube and onto the toothbrush.
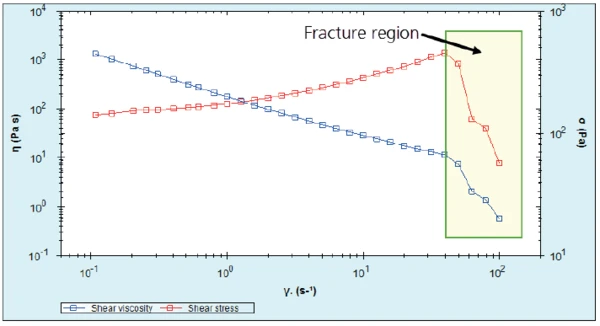
Figure 1 shows an equilibrium flow curve profile for a typical toothpaste. Note the sharp decrease in viscosity at 40 s-1, corresponding to the fracture of the toothpaste between the upper and lower geometries.
Sample fracture can be delayed (in terms of shear rate) by the use of a parallel plate geometry, which allows the application of a smaller gap size, but it cannot be eliminated entirely. The use of a narrow gap may actually be detrimental in the case of highly filled materials containing large particles, as it is necessary to use a large enough gap to avoid the particles jamming under shear[1].
An alternative technique for measuring the shear flow properties of such systems is squeeze flow. This involves loading a sample between parallel plates, then measuring the normal force generated by the sample as the gap closes at a constant speed for example. A method, which accounts for partial wall slip, has been developed by Laun et al (Laun, Rady, & Hassager, 1999) to convert gap and normal force data into shear stress and shear rate allowing shear viscosity to be calculated as a function of shear rate. The maximum shear rate available at a set gapping speed is limited by the maximum normal force capability of the rheometer, but can often exceed the shear rate achievable using rotational rheometry, where the sample exhibits edge fracture.
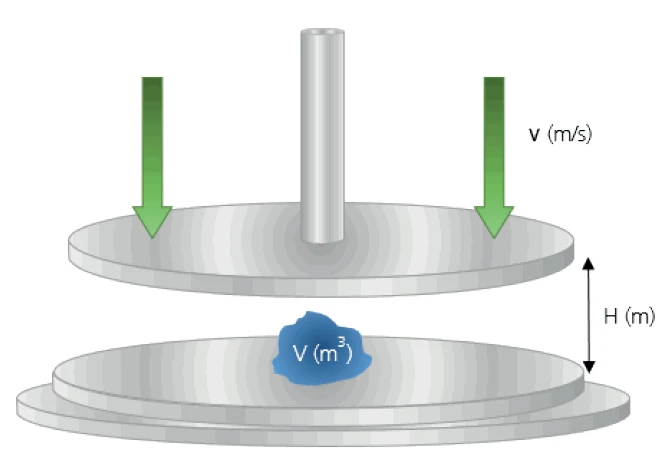
The methodology is such that a defined volume of sample is loaded onto the center of the lower geometry plate, and then, the upper plate is lowered at a constant speed to a defined end gap, see Figure 2. The upward force generated by the sample resisting the downward movement of the geometry and the corresponding gap is measured as a function of time.
Experimental
- The squeeze flow behavior of toothpaste was evaluated at gapping speeds of 2 mm/s and 10 mm/s.
- Measurements were made on 1-g aliquots of toothpaste, using a Kinexus rotational rheometer with a Peltier plate cartridge and a 60 mm parallel plate measuring system, utilizing a squeeze flow sequence in the rSpace for Kinexus software.
- Comparison rotational flow curve data was generated using a 40 mm roughened parallel plate with a 1 mm gap and using a standard pre-configured rSpace sequence.
- All measurements were performed at a temperature of 25°C.
- Sample mass was converted to volume using a toothpaste density of 1.3 g/cm3.
Results and Discussion
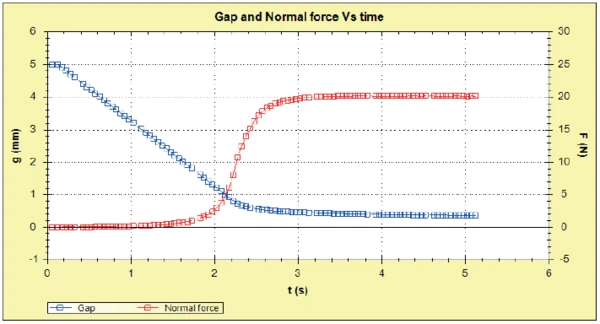
A gap and normal force profile for toothpaste, with a gapping speed of 2 mm/s, is shown in Figure 3. The blue line representing gap, shows the approach of the upper geometry plate to the sample. As the plate comes into contact with the sample, it forms a compressed cylinder of increasing diameter and the red line, representing normal force, starts to increase. As the upper geometry reaches the defined end gap, the compressive force becomes constant as the squeezing stops.
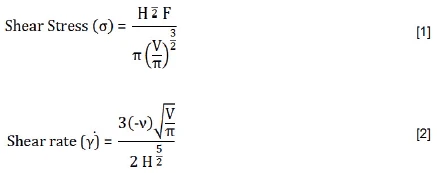
Normal force and gap data are then converted into shear stress and shear rate, respectively, automatically at the end of the measurement action using equations [1] and [2]. Shear viscosity is then calculated by dividing the resultant shear stress by the corresponding shear rate.
The resulting flow curve generated from squeeze flow data using a gapping speed of 2 mm/s is shown in Figure 4. This chart shows three distinct regions in terms of sample flow behavior; up to approx. 7 s-1 the sample is just starting to flow as compressive forces start to increase; from 7 s-1, the viscosity profile shows a gradient change as the sample exhibits flow; a further gradient change occurs above 150 s-1 as the compressive forces reach a maximum and sample flow stops. As such, only the data of constant sample flow is utilized from the measurement.
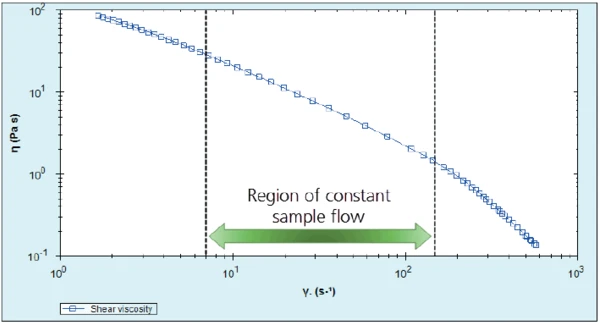
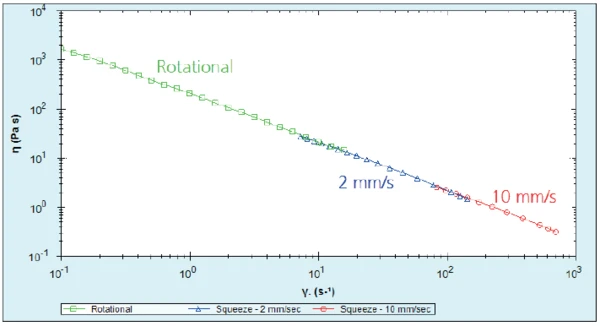
The squeeze flow test was repeated for a fresh 1-g aliquot of toothpaste and this time using a gapping speed of 10 mm/s. A comparison of both 2 and 10 mm/s data is shown in Figure 5, together with equilibrium flow data obtained using traditional rotational rheometry.
It can be seen that the squeeze flow data matches up extremely well with the rotational data, extending the shear rate from a maximum of 20 s-1 for rotational measurements, to 700 s-1 for squeeze flow measurements. Of course, different samples may be more or less suitable for the squeeze flow technique than that shown here, hence trial measurements are recommended for any new analysis.
Conclusion
A Kinexus rotational rheometer with advanced axial test capabilities can be used to extend the measurable shear rate range of concentrated suspensions, which are prone to fracture, by using the squeeze flow technique. Calculated viscosities for toothpaste obtained by squeeze flow measurements gave comparable data to traditional rotational rheometry and extended the shear rate range by nearly two orders of magnitude.
Footnote
[1] The size of the gap should be 10 x the size of the maximum particle so that there is enough free space between the particles for them to move freely. With increasing shear rate and a narrow gap, large particles tend to jam together, falsifying flow behavior.