Introduction
Factory quality control indicators for polymer materials usually include the Melting Temperatures and EnthalpiesThe enthalpy of fusion of a substance, also known as latent heat, is a measure of the energy input, typically heat, which is necessary to convert a substance from solid to liquid state. The melting point of a substance is the temperature at which it changes state from solid (crystalline) to liquid (isotropic melt).melting point, Tm, the Glass Transition TemperatureThe glass transition is one of the most important properties of amorphous and semi-crystalline materials, e.g., inorganic glasses, amorphous metals, polymers, pharmaceuticals and food ingredients, etc., and describes the temperature region where the mechanical properties of the materials change from hard and brittle to more soft, deformable or rubbery.glass transition temperature, Tg, and the melt flow index, MFI. However, can we be confident that we can produce our product reliably and that the production process runs smoothly and consistently by referring only to these indicators? The following case shows that the answer to this question is not necessarily yes.
Customer: I have several batches of polycarbonate for fiber spinning, and all the factory’s quality control indicators are consistent. The melt flow index is also the same, so I think flowability should be consistent. However, there are problems during processing. Some batches of polymer can be spun smoothly, while others showed serious fiber breakage and cannot continuously form fibers.
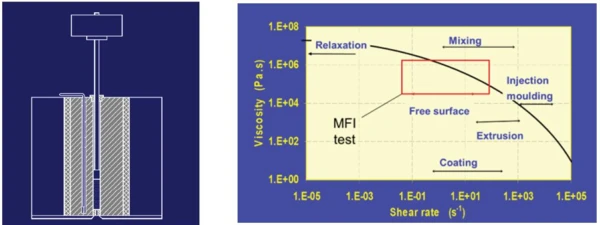
All batches have the same MFI values. In this method, the polymer melt is extruded through a capillary die at a constant temperature, and the rate at which the material flows through is measured over a set time (figure 1, left), providing insight into the polymer's flow properties. The MFI is representative of a single-point shear viscosity (figure 1, right). This testing method is similar to the capillary rheometer, but limited to a small shear rate range. However, production processes such as extrusion, injection molding, spinning, etc., are carried out at higher shear rates than those characterized with the MFI method. Therefore, the test results of MFI cannot fully reflect the flow behavior of materials under various processing techniques (figure 1, right). At this point, it is necessary to establish a flow curve with a wider range of shear rates for evaluating polymer flowability in processing conditions. The solution is to use the Rosand capillary rheometer. Therefore, it was used in this study to obtain the shear viscosity over a wide shear rate range to understand if the behavior between batches varies at these higher shear rates relevant for spinning.
Measurement Conditions
The measurement conditions are detailed in table 1.
Table 1: Measurement conditions
| Sample | Polycarbonate PC (main component) |
|---|---|
| Test mode | Constant shear rate test (flow curve), single bore |
| Temperature | 260°C |
| Pressure sensor | 10000 psi |
| Die | 1:16 |
*modified components are now known
Measurement Results
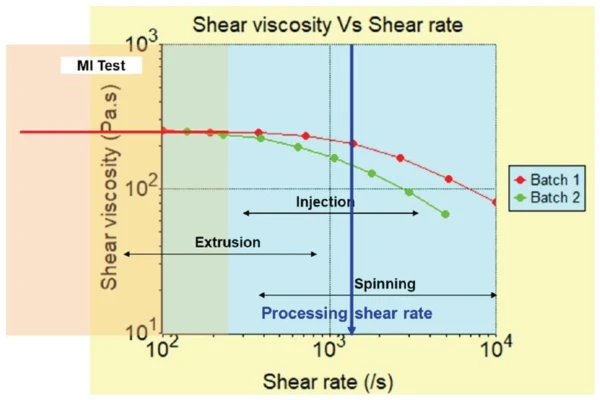
Figure 2 shows the flow curve results for two different batches of polycarbonate at 260°C. They both exhibit a Shear ThinningThe most common type of non-Newtonian behavior is shear thinning or pseudoplastic flow, where the fluid viscosity decreases with increasing shear.shear-thinning fluid state with a zero-shear plateau, in which the shear viscosity does not change with the shear rate; this is a feedback of the viscosity of the sample at low shear rates. It can be linked to the intrinsic viscosity IV, and there is a linear relationship between the zero-shear viscosity and IV. These two batches of sample have the same zero-shear viscosity. The shear rate range for MFI testing is exactly within the zero-shear viscosity plateau, so that explains that the customer didn’t observe a difference in MFI between the two batches of sample. However, with the increase in shear rate, there is a significant difference in the Shear ThinningThe most common type of non-Newtonian behavior is shear thinning or pseudoplastic flow, where the fluid viscosity decreases with increasing shear.shear-thinning behavior. The viscosity of batch 1 decreased slowly with increasing shear rate, while the viscosity of batch 2 decreased rapidly. According to the processing parameters like die shape, die size, and volume flow rate provided by the customer, it is estimated that the shear rate at the customer site is approximately 1,300 s-1. As shown in figure 2, it can be seen that although the MFI results are the same, there is a significant difference in shear viscosity at 1300 s-1 (blue line), which explains the customer’s processing problems. As they were using the same processing conditions, the two batches behaved quite differently resulting in breakages, etc.
The intrinsic viscosity (IV) describes the capacity of a polymer to increase the viscosity of a solvent [1]. It is measured by determining the relative viscosities of several polymer solutions at different concentrations [2]. The intrinsic viscosity of a polymer is closely related to its molecular weight.
Conclusion
The melt flow index, MFI, does not capture the flow behavior of polymer materials during processing, as it is limited to a narrow shear rate range. In contrast, tests using the Rosand capillary rheometer generate flow curves over a broader range of shear rates, offering valuable insights into potential processing issues with polymer materials. As a result, this rheometer serves as a crucial tool for quality control and optimizing processing conditions.