Introduction
Photopolymers are light-sensitive materials that polymerize upon exposure to light, transforming liquid monomers or oligomers into solid, functional networks. In additive manufacturing (AM) processes, including multiphoton lithography and fusion jetting (FJ) [1], the Curing (Crosslinking Reactions)Literally translated, the term “crosslinking“ means “cross networking”. In the chemical context, it is used for reactions in which molecules are linked together by introducing covalent bonds and forming three-dimensional networks.curing behavior of acrylate photopolymers is strongly influenced by both UV light intensity and temperature. In AM, Curing (Crosslinking Reactions)Literally translated, the term “crosslinking“ means “cross networking”. In the chemical context, it is used for reactions in which molecules are linked together by introducing covalent bonds and forming three-dimensional networks.curing of material is done layer by layer with typical layer thicknesses around 50 to 100 μm [2,3], where the material experiences self-heating due to ExothermicA sample transition or a reaction is exothermic if heat is generated.exothermal Curing (Crosslinking Reactions)Literally translated, the term “crosslinking“ means “cross networking”. In the chemical context, it is used for reactions in which molecules are linked together by introducing covalent bonds and forming three-dimensional networks.curing reaction.
The aim of this study is to investigate the thermal behavior of diacrylate photopolymer layers under varying IsothermalTests at controlled and constant temperature are called isothermal.isothermal conditions and UV light intensities, using NETZSCH Dielectric Analysis for experimental monitoring along with the Kinetics Neo [5] and Termica Neo [6] software for kinetic analysis, thermal simulation, and hotspot identification.
Measurement Conditions
DEA measurements were performed using NETZSCH DEA instrumentation under the measurement conditions listed in table 1. The DEA curves obtained are the basis for the kinetic analysis.
Figure 1 shows our instrument for Dielectric Analysis (DEA), which enables in-situ measurement of the Curing (Crosslinking Reactions)Literally translated, the term “crosslinking“ means “cross networking”. In the chemical context, it is used for reactions in which molecules are linked together by introducing covalent bonds and forming three-dimensional networks.curing behavior of various reactive materials. Multiple sensors allow for precise measurement of temperature and Ion ViscosityIon viscosity is the reciprocal value of the ion conductivity, which is calculated from the dielectric loss factor.ion viscosity, ensuring optimal performance and quality.
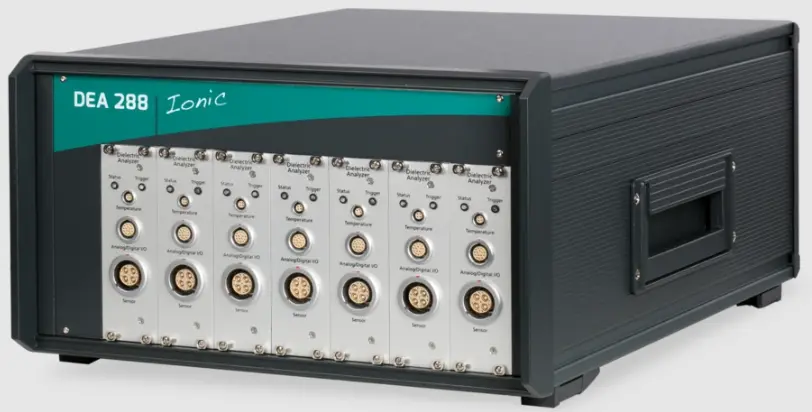
Table 1: Measurement conditions
| Instrument | NETZSCH DEA 288 Ionic |
|---|---|
| Material | Photopolymer diacrylates (UV DLP Firm) |
| IsothermalTests at controlled and constant temperature are called isothermal.Isothermal temperature/°C | 30, 90 and 150 |
UV intensities at 30°C/mW/cm² | 36, 75, 150 and 300 |
| Radiation time/min | 10 |
| Sensor | IDEX sensor |
| Frequency/Hz | 10 |
Kinetic Analysis
Kinetics Neo software is used to create a unified model for different temperatures and intensities of UV light with an intensity of I0 = 75 mW/cm². Detailed information about the kinetic modelling of Curing (Crosslinking Reactions)Literally translated, the term “crosslinking“ means “cross networking”. In the chemical context, it is used for reactions in which molecules are linked together by introducing covalent bonds and forming three-dimensional networks.curing under different UV intensities can be found in Part 1[4].
Figure 2 illustrates the effects of temperature and UV intensity on the curing behavior of photopolymer diacrylates, measured by DEA (Dielectric Analysis). A common kinetic model was created using the Kinetics Neo software. Rhombus symbols represent the experimental data, and the solid lines correspond to the fitted curves. Table 2 details the kinetics parameters based on the DEA measurements.
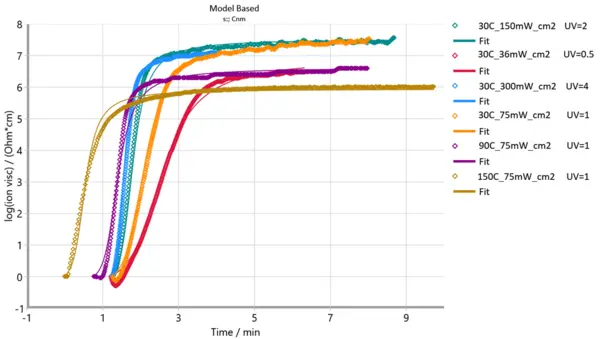
Table 2: Kinetic parameters of photopolymer acrylates based on DEA measurements
| Reaction step | A → B |
|---|---|
| Reaction type | Cnm |
| Activation energy [kJ/mol} | 5.174 |
| Log (pre-exponential factor) [Log (1/s)] | -1.793 |
| Reaction order | 1.724 |
| Log (Autocat pre-exponential factor [Log(1/s)] | 1.629 |
| AutcatPower mf | 1.136 |
| nUV Light | 0.619 |
| I0 [mW/cm²] | 75 |
| Coefficient of determination (R²) | 0.996 |
Cnm: Reacton ofnth order with m-power autocatalysis
Termica Neo Software: Simulation
The ExothermicA sample transition or a reaction is exothermic if heat is generated.exothermal curing process induces self-heating within the material, resulting in the formation of internal temperature gradients. In this work, we simulate the thermal curing behavior of diacrylate photopolymer layers modeled as an infinite slab geometry, with thicknesses of 100 μm and 300 μm, and with an enthalpy of 301 J/g from our DSC measurements. In the simulation of AM processes, the reactive layer is placed above a thick polymer block of 10 cm with a controlled temperature of 25°C below this block. The surrounding temperatures at the top surface of this reactive layer are 90°C and 150°C under UV exposure with a given intensity of 75mW/cm2. The simulation shows how the temperature changes over time in the layers during the curing process.
Figures 3 (a) and 3 (b) present the simulation of temperature evolution over three minutes during the curing process for 100-μm and 300-μm layers. Both layers reach their peak temperatures at approximately the same time (0.7 minutes): 90.4°C for the 100-μm layer and 92.4°C for the 300-μm layer for x=100%, which corresponds to the full reference thickness at the top surface layer. The higher temperature in the thicker layer indicates reduced heat dissipation. In thick layers, the ExothermicA sample transition or a reaction is exothermic if heat is generated.exothermic reaction releases more accumulated enthalpy internally, leading to self-heating and a higher temperature than thin layers.
(a) and 300 μm

(b) at the same temperature of 90°C and an intensity of 75 mW/cm².
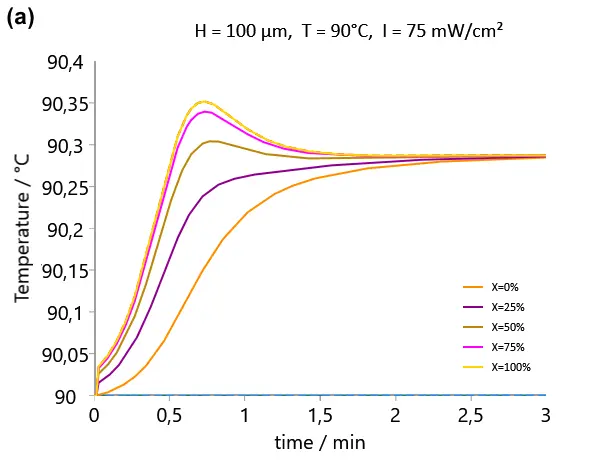
Figures 4 (a) and 4 (b) show the simulated temperature profiles over a three-minute curing cycle for a 100-μm layer under different IsothermalTests at controlled and constant temperature are called isothermal.isothermal conditions of 50°C and 150°C. For both layers, the peak temperature increased by approximately 0.35°C for a 100-μm layer. At the different IsothermalTests at controlled and constant temperature are called isothermal.isothermal conditions of 50°C and 150°C, the main difference was in the time to reach the peak temperature for x=100%, which corresponds to the full reference thickness at the top surface layer: at 150°C, it occurred faster, in 0.6 minutes, while at 50°C, it took 1.1 minutes.
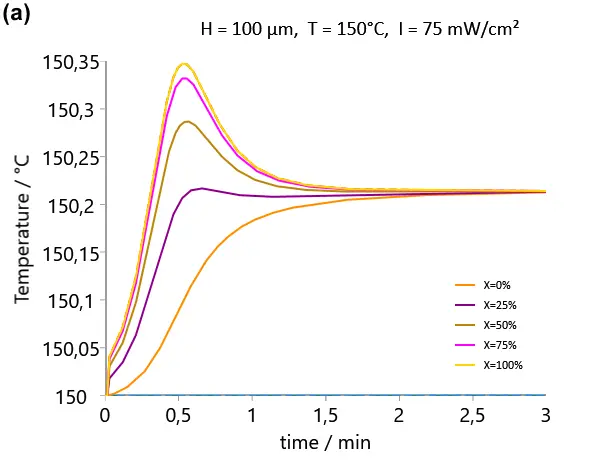
(a) and 150°C
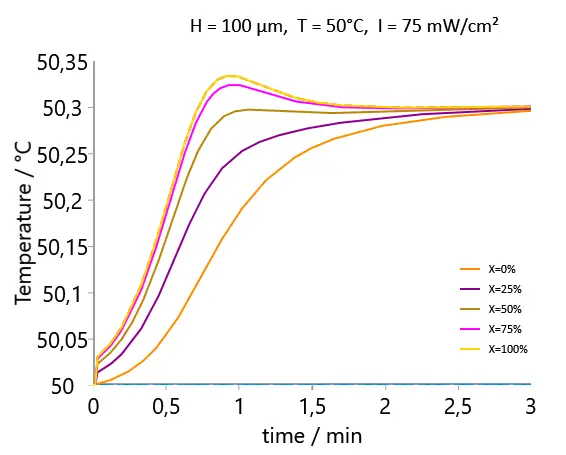
(b) for the same layer thickness of 100 μm and an intensity of 75 mW/cm².
Figure 5 (a) shows the simulation of temperature evolution over three minutes during the curing process of a 300-μm layer at 150°C. The peak temperature increased by approximately 2.6°C for this layer for x=100%, which corresponds to its top surface.
Figure 5 (b) presents a 3D surface plot illustrating temperature as a function of both layer depth and time. Figure 5 (c) depicts a 3D heatmap showing the spatial temperature variation across the layer over time. These visualizations enable rapid identification of thermal hotspots.

(a) Temperature profiles in the layer for different vertical positions during curing
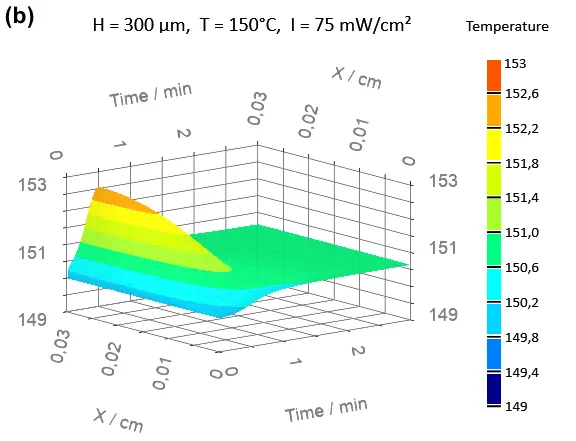
(b) 3D surface depiction of temperature evolution in the layer as a function of coordinate and time

(c) 3D heatmap of temperature evolution in the layer.
Conclusion
Dielectric Analysis (DEA) is an effective tool for monitoring UV photopolymers. It can be used not only in the laboratory but also directly on the production line. When combined with the Kinetics Neo software, DEA measurements have been proven to effectively determine kinetic parameters that are a function of both temperature and UV intensity. Termica Neo software adds significant value by simulating the thermal behavior of photopolymer layers, predicting temperature evolution, identifying potential hotspots, and enabling optimization of layer thickness and curing conditions.
Benefits of Thermal Simulation
Thermal Safety and Reliability: Simulate temperature evolution in different layer thicknesses to prevent overheating or uneven curing.
Hotspot Identification: Detect thermal hotspots using 3D temperature profiles and heatmaps.
Time and Cost Efficiency: Reduce trial-and-error experiments and minimize material waste.

Application Note: Part 1
Find out more about: Kinetic Analysis of Photopolymer Curing Under Variable UV Light Intensities Using Kinetics Neo and DEA in Part 1