
30.11.2020 by Dr. Alexander Schindler
Smart Thermal Analysis: Measurements Wanted?
Imagine the typical situation in everyday laboratory work: A new sample has to be analyzed, but what are the suitable measurement conditions such as temperature program, sample mass or the right crucible? And what measurement results can be expected? Perhaps such kind of sample was already measured by you in the past ‒ or maybe by NETZSCH. Wouldn’t it help a lot to simply search in a database for thermal analysis? Identify, which is a part of the Proteus® analysis software, is the solution!
The initial purpose of the Identify database system is the automatic recognition and comparison of measurement curves. This serves, for example, for quality control and failure analysis. Pure data mining (storing, searching and finding of data) is, of course, the second main application.
How to do data mining with Identify?
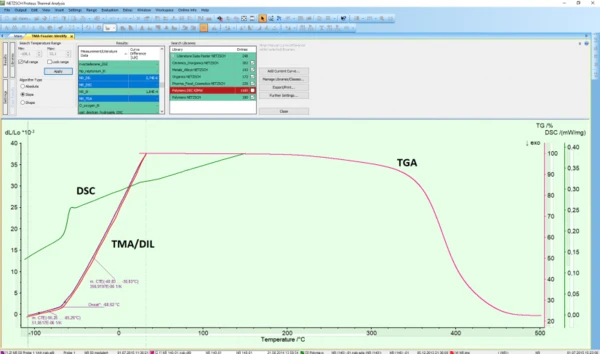
One approach of using Identify is to search for similar database measurements or literature data on the base of an input measurement curve. This is illustrated in figure 1, where a Thermomechanical Analysis (TMA) measurement is compared with various database curves. The similar TMA curve was found automatically by Identify, the DSC and TGA curves were in this case found easily by alphabetical sorting of all database measurements shown. It is interesting to see that the Glass Transition TemperatureThe glass transition is one of the most important properties of amorphous and semi-crystalline materials, e.g., inorganic glasses, amorphous metals, polymers, pharmaceuticals and food ingredients, etc., and describes the temperature region where the mechanical properties of the materials change from hard and brittle to more soft, deformable or rubbery.glass transition occurs between -70…-60°C (see also the Differential Scanning Calorimetry, DSC, curve) and that the Decomposition reactionA decomposition reaction is a thermally induced reaction of a chemical compound forming solid and/or gaseous products. decomposition – which should normally be avoided in DSC or TMA measurements – starts slowly at above 150°C visible in the Thermogravimetry (TGA) curve.
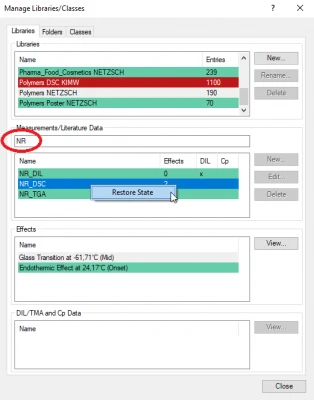
The second approach of data mining – where no similar input measurement is required – is related to the “Manage Libraries/Classes” function (see figure 2). In this case, “NR” was typed in manually in the search field for measurements and literature data, and consequently, the three different NR measurements were found. Restoring of any database measurement, which is simply done via right mouse click, opens the measurement where also the measurement conditions such as temperature program, sample mass, purge gases and sample crucible can be seen in detail.
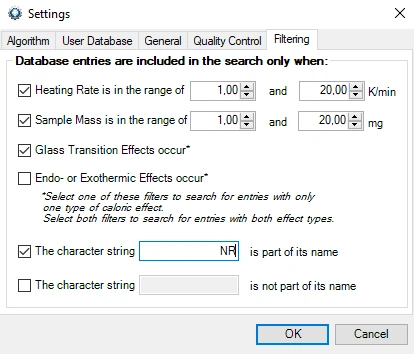
Last but not least, Identify offers also the possibility to filter according to the heating rate, the sample mass and if Glass Transition TemperatureThe glass transition is one of the most important properties of amorphous and semi-crystalline materials, e.g., inorganic glasses, amorphous metals, polymers, pharmaceuticals and food ingredients, etc., and describes the temperature region where the mechanical properties of the materials change from hard and brittle to more soft, deformable or rubbery.glass transitions or EndothermicA sample transition or a reaction is endothermic if heat is needed for the conversion.endothermic and ExothermicA sample transition or a reaction is exothermic if heat is generated.exothermic effects were evaluated. If a string of letters occurs in a measurement name or not, may also be a filter criterion (see figure 3).
The database content of Identify
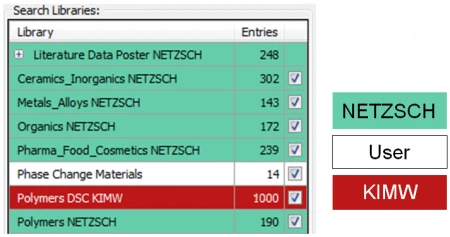
Shown in figure 4 are the NETZSCH libraries currently containing 1294 entries, which cover various application fields (ceramics, inorganics, metals, alloys, organics, pharma, food, cosmetics and polymers). Available as an option is the KIMW database developed by the Kunststoffinstitut Lüdenscheid, Germany, with DSC curves for 1000 different commercially available polymer grades, where information about the polymer supplier, color and filler material/content is also available.
In summary, measurements, associated measurement conditions and evaluations can be easily found and retrieved for all measurements stored in Identify. This knowledge treasured can be helpful prior to and after any measurement!
Please feel free to visit earlier, related blog articles:
Smart Thermal Analysis (Part I): AutoEvaluation of DSC, TGA and STA curves
Smart Thermal Analyis (Part II): Identification of Measurements via Database Search
Smart Thermal Analyis (Part IIb): Identify … the Most Comprehensive Database in Thermal Analysis
Smart Thermal Analysis (Part III): AutoEvaluation of DIL and TMA curves