Introduction
Polypropylene (PP) is an often-used raw material for manufacturing thin films like separator films in batteries. This experiment was initiated due to a problem arising during the processing of PP films. Products from certain batches of raw PP granules were easy to break while those from the other batches featured good quality. The objective was to find out the reason behind this, and more importantly, to set up a method for reliable QC of the raw PP granules. Ideally, this QC method would be carried out with a basic DSC or TGA.
Experimental Conditions
Several “good” samples (marked as OK) and “bad” samples (marked as NOK) were collected.
Melting Temperatures and EnthalpiesThe enthalpy of fusion of a substance, also known as latent heat, is a measure of the energy input, typically heat, which is necessary to convert a substance from solid to liquid state. The melting point of a substance is the temperature at which it changes state from solid (crystalline) to liquid (isotropic melt).Melting/cooling tests were carried out by means of the DSC 214 Polyma. The samples were heated from room temperature (RT) to 200°C at 10 K/min, then cooled down to RT at -10 K/min, followed by a second heating to 200°C at 10 K/min. The testing atmosphere was N2; the sample sizes were around 10 mg.
Oxidative-Induction Time (OIT) and Oxidative-Onset Temperature (OOT)Oxidative Induction Time (isothermal OIT) is a relative measure of the resistance of a (stabilized) material to oxidative decomposition. Oxidative-Induction Temperature (dynamic OIT) or Oxidative-Onset Temperature (OOT) is a relative measure of the resistance of a (stabilized) material to oxidative decomposition.OIT tests samples were additionally carried out by means of the DSC 214 Polyma. The samples were heated from RT to 200°C in N2 at 10 K/min, then kept IsothermalTests at controlled and constant temperature are called isothermal.isothermal at 200°C for 5 min. After that, the atmosphere was switched to O2 (pure) and the time from the switch point to the onset of OxidationOxidation can describe different processes in the context of thermal analysis.oxidation was recorded. Sample sizes were around 10 mg.
PyrolysisPyrolysis is the thermal decomposition of organic compounds in an inert atmosphere.Pyrolysis tests were done by means of the TG 209 F3 Tarsus®. The samples were heated from RT to 800°C at 10 K/min in N2. The sample size was around 10 mg.
Results and Discussion
1. Failure Analysis
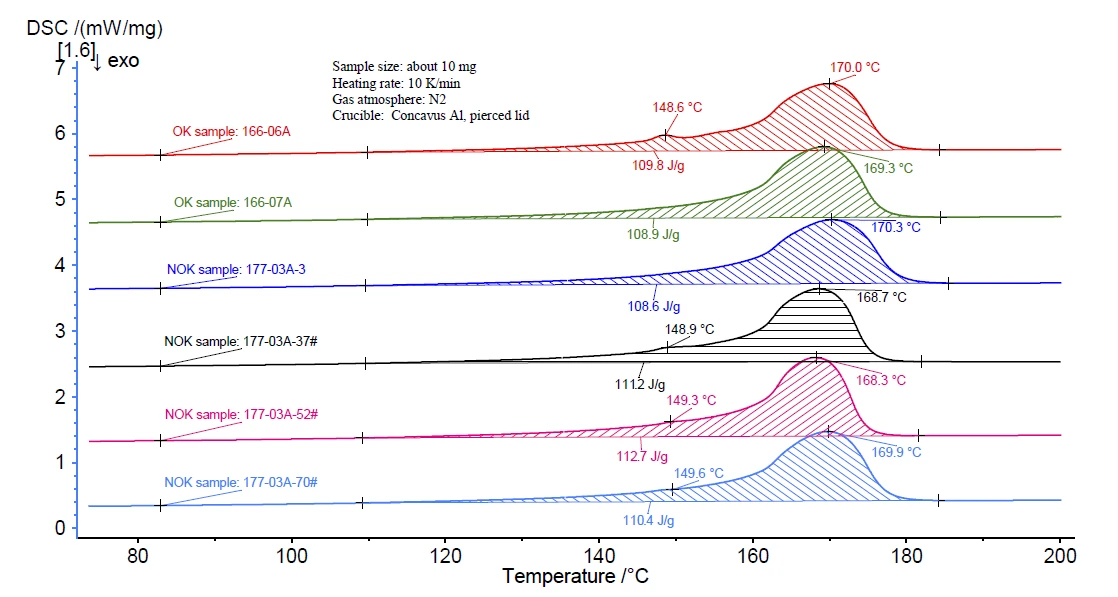
As a first step, the melting behavior of all samples was compared to see if there were any impurities, i.e., other polymer components. As shown in figure 1, along with the main melting peak of PP at about 169°C, a small endothermal peak at 148°C can be seen in some DSC curves. This might be due to a second polymer component or additive. However, such a difference cannot be taken as a QC target because this small peak can be found in both the OK and NOK samples.
1.2. PyrolysisPyrolysis is the thermal decomposition of organic compounds in an inert atmosphere.Pyrolysis Behavior
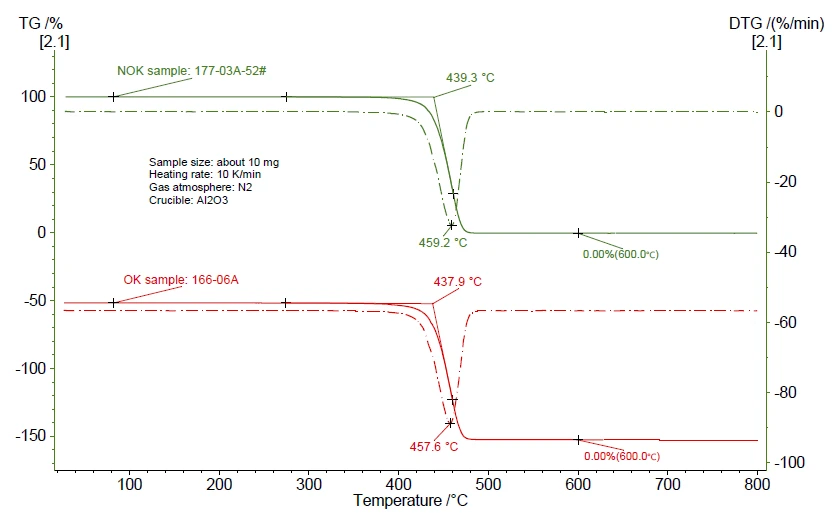
To confirm existence of impurities, the TGA PyrolysisPyrolysis is the thermal decomposition of organic compounds in an inert atmosphere.pyrolysis results were compared in figure 2. It seems that both the OK and NOK samples show a weight loss of 100%, and there was no obvious difference between them within the entire PyrolysisPyrolysis is the thermal decomposition of organic compounds in an inert atmosphere.pyrolysis procedure.
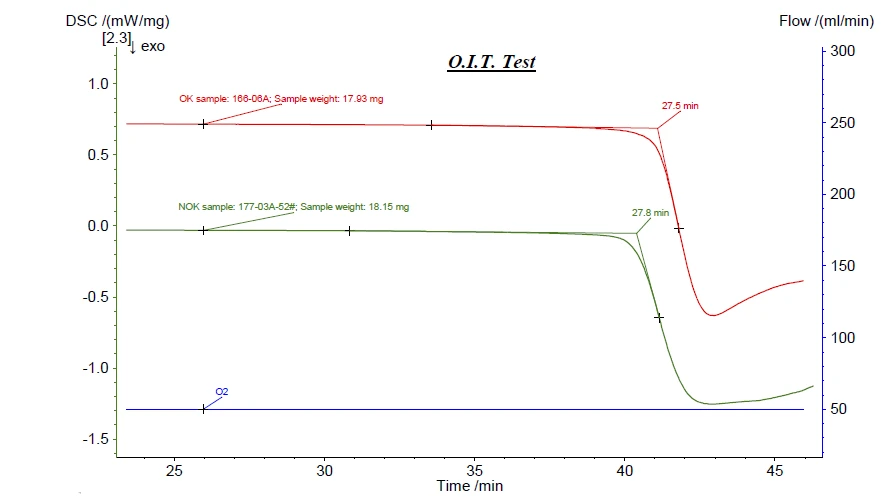
“Brittleness” of polymer materials can be a result of differently stabilized materials. Information on the stabilization of a polymer can be distinguished by Oxidative-Induction Time (OIT) and Oxidative-Onset Temperature (OOT)Oxidative Induction Time (isothermal OIT) is a relative measure of the resistance of a (stabilized) material to oxidative decomposition. Oxidative-Induction Temperature (dynamic OIT) or Oxidative-Onset Temperature (OOT) is a relative measure of the resistance of a (stabilized) material to oxidative decomposition.OIT measurements. Therefore, differing OITs were expected for these samples; such results could then be used as a QC threshold. Unfortunately, as shown in figure 3, there were no significant Oxidative-Induction Time (OIT) and Oxidative-Onset Temperature (OOT)Oxidative Induction Time (isothermal OIT) is a relative measure of the resistance of a (stabilized) material to oxidative decomposition. Oxidative-Induction Temperature (dynamic OIT) or Oxidative-Onset Temperature (OOT) is a relative measure of the resistance of a (stabilized) material to oxidative decomposition.OIT differences between the OK and NOK samples.
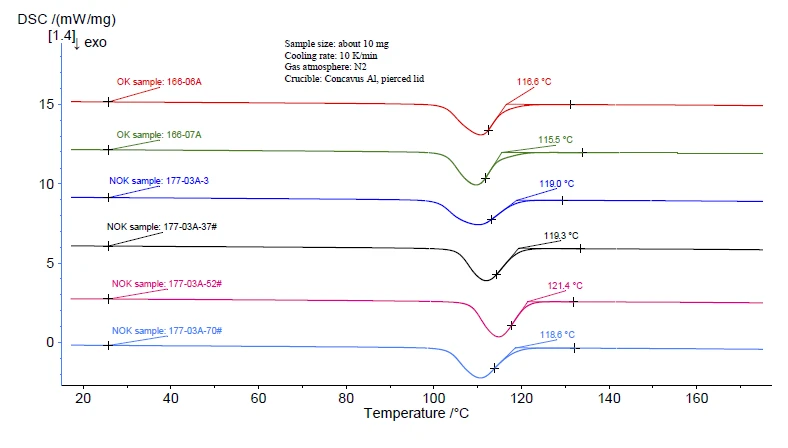
The manufacturing process for PP films includes melting of the PP granules followed by the extrusion process. A cooling procedure must have occurred to have induced CrystallizationCrystallization is the physical process of hardening during the formation and growth of crystals. During this process, heat of crystallization is released.crystallization. Since the CrystallizationCrystallization is the physical process of hardening during the formation and growth of crystals. During this process, heat of crystallization is released.crystallization behavior can also be a factor affecting the quality of the final product, the cooling curves were compared. As shown in figure 4, significant differences in the CrystallizationCrystallization is the physical process of hardening during the formation and growth of crystals. During this process, heat of crystallization is released.crystallization behavior between the OK and NOK samples can be seen. Firstly, the onset of CrystallizationCrystallization is the physical process of hardening during the formation and growth of crystals. During this process, heat of crystallization is released.crystallization of the OK samples (~115°C) is much lower than that of the NOK samples (~119°C). This means that the NOK samples crystallize more easily. Moreover, the slope of the right side of the DSC peak of the NOK samples appears to be steeper than that of the OK samples. This means that the NOK samples also crystallize faster than the OK samples.
1.5. Summary of Failure
Analysis Based on the previous measurements and discussions, we can assume that the “brittle film” problem is probably due to differing CrystallizationCrystallization is the physical process of hardening during the formation and growth of crystals. During this process, heat of crystallization is released.crystallization behavior of the raw materials. For raw materials that crystallize more easily (higher onset), or crystallize faster (steeper slope), the product films break more easily. The difference inCrystallizationCrystallization is the physical process of hardening during the formation and growth of crystals. During this process, heat of crystallization is released. crystallization may be caused by differing content with regard to nucleation agents, micro-particles, etc.
2. Quality Control Criterion
Based on the conclusion above, the QC criterion can be focused on theCrystallizationCrystallization is the physical process of hardening during the formation and growth of crystals. During this process, heat of crystallization is released. crystallization behavior. A simpler solu-tion would be to use theCrystallizationCrystallization is the physical process of hardening during the formation and growth of crystals. During this process, heat of crystallization is released. crystallization onset tempera-ture as the QC threshold. This, however, would require manual evaluation (by the operator) and there might be critical issues in the case of “non-ideal” CrystallizationCrystallization is the physical process of hardening during the formation and growth of crystals. During this process, heat of crystallization is released.crystallization peaks and baselines. Moreover, the onset temperature cannot reflect the entire situation with regard to crystal-lization behavior. To compare theCrystallizationCrystallization is the physical process of hardening during the formation and growth of crystals. During this process, heat of crystallization is released. crystallization behav-ior in a more comprehensive way, NETZSCH offers the ideal tool: a solution called Identify.
Simply speaking, with Identify it is possible to build a database from the cooling curves for the OK samples. The software would then compare these with the cool-ing curves for the incoming PP granules and could deter-mine whether the incoming PP raw materials are “QC Pass” or “Fail”.
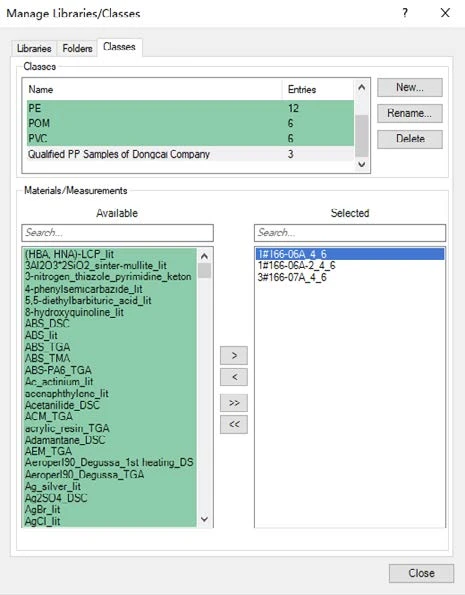
For this case, we created a Class in the Identify database with the cooling curves for three OK samples. In a real scenario, of course, more curves would be encouraged in order to build a more reliable Class.
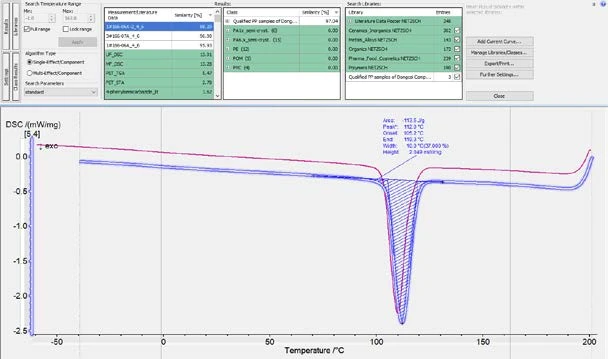
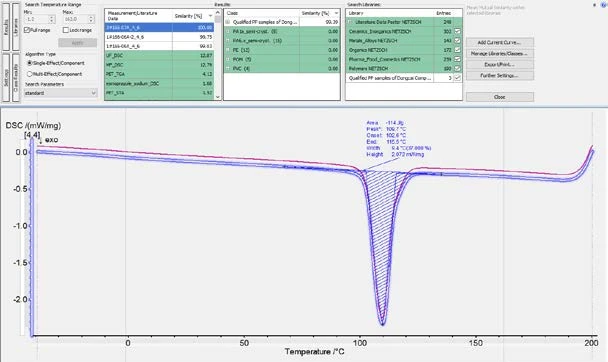
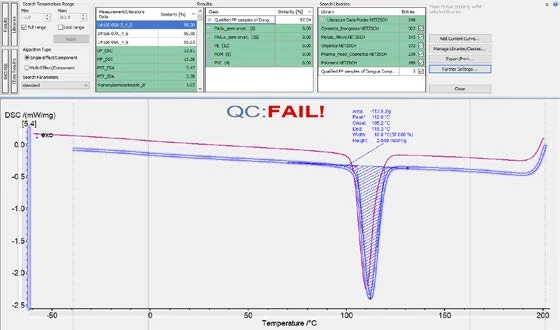
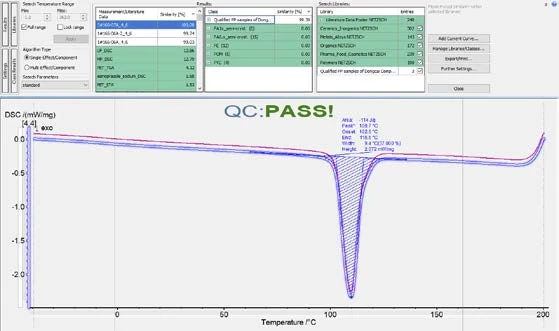
As shown in figures 6 and 7, it is possible to calculate the similarity of the cooling curves for the OK and NOK samples to the Class. For the OK samples, the similarity would be higher than 99% and for the NOK samples, the similarity would be below 99%. Therefore, it is reasonable to set a similarity threshold at 99%. That is to say, samples can be regarded as a “QC Pass” when the cooling curve has a similarity to the OK Class of higher than 99%. In fact, the Identify feature offers a function for running this QC check automatically.
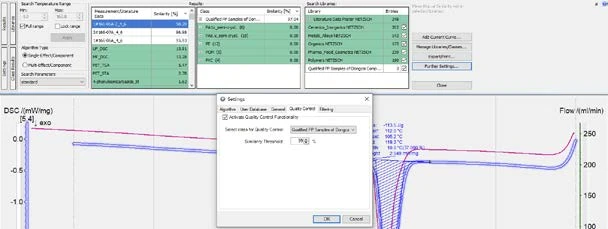
As shown in figure 8, in the “Further settings” window, the user can define a threshold (99% in this case). After that, when a sample’s cooling curve is loaded into Proteus® software and Identify is triggered, the similarity of the curve to the Class will be calculated, and a QC mark of “FAIL” or “PASS” will automatically appear based on the pre-defined QC threshold (figure 9).
Conclusion
These test series of DSC and TGA measurements were carried out with the objective of finding the source of failure. It was determined that the quality of the PP films depends on theCrystallizationCrystallization is the physical process of hardening during the formation and growth of crystals. During this process, heat of crystallization is released. crystallization behavior of the PP granules.
It is possible to use the CrystallizationCrystallization is the physical process of hardening during the formation and growth of crystals. During this process, heat of crystallization is released.crystallization onset temperature of the DSC cooling curve as a simple QC method.
However, a more comprehensive and reliable solution can be achieved by applying NETZSCH Identify to compare the sample’s DSC cooling curve to a reference Class, which can be built from a number of cooling curves for the OK samples. Identify can calculate the similarity of the sample curve to the Class and automatically present QC results via a pre-defined QC threshold.