Introduction
In the polymer industry, the Melt Flow Index (MFI) and Melt Volume Rate (MVR) are fundamental metrics used to assess the flow characteristics of thermoplastics. MFI (or MFR for Melt Flow Rate) measures the mass of polymer that flows through a die under specific conditions, typically expressed in grams per 10 minutes, while MVR measures the volume of polymer flowing under the same conditions, expressed in cubic centimeters per 10 minutes. These metrics are standardized under ISO 1133 and ASTM D-1238 and are commonly used for quality control, material selection, and comparing resins from different suppliers. MFI and MVR are standard measurements in quality control to monitor changes between batches or with a batch during processing. MFI is more commonly used than MVR and is frequently employed to evaluate and compare recyclates, providing a quick method for assessing the flow properties of these materials. However, this use can be misleading, as these metrics do not accurately represent the behavior of polymers under the high shear rates typical of industrial processing. This discrepancy is particularly critical in processes like injection molding, where the flow and solidification properties of the thermoplastic melt are crucial. The flow of a thermoplastic melt is described by its dynamic viscosity, which is dependent on the shear rate. The greater the shear rate, the lower the viscosity of the melt, meaning it flows more easily as it moves faster. This characteristic is determined in a capillary rheometer. This application note explores these limitations and explains why shear viscosity measurements obtained via capillary rheometry provide a more comprehensive understanding of polymer processability. Using polypropylene (PP) as a case study, we compare MFI-derived viscosity with shear viscosity measured across a range of shear rates and temperatures.
Understanding MFI and MVR
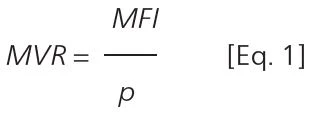
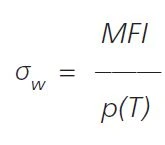
MFI and MVR are closely related metrics, and the conversion between them depends on the DensityThe mass density is defined as the ratio between mass and volume. density of the polymer melt at the test temperature. The relationship is given by:
with
MVR is the Melt Volume Rate (cm³/10min)
MFI is the Melt Flow Index (g/10min)
р is the DensityThe mass density is defined as the ratio between mass and volume. density of the polymer melt (g/cm³).
This conversion allows MFI and MVR to be used interchangeably when the DensityThe mass density is defined as the ratio between mass and volume. density is known, enabling comparisons between materials with different densities. This is particularly useful when assessing recyclates, which may vary in DensityThe mass density is defined as the ratio between mass and volume. density due to contamination, degradation, or the mixing of different polymer grades. However, while MFI is convenient for these comparisons they provide only a limited view of a polymer’s flow characteristics. Each of the two metrics portrays only a single data point on the flow curve, derived under specific conditions that do not mimic the high shear rates and complex flow environments typical of industrial processing. This limitation is especially critical when comparing recyclates, as these materials can exhibit significant variations in behavior that are not captured by MFI alone.
The Limitations of MFI/MVR in Real-World Applications
MFI is widely used because it offers a simple and quick method to assess the basic flow characteristics of polymers. However, its simplicity can be misleading. MFI measures the flow rate of a polymer melt at a low shear rate. The true shear rate γw at the wall can be computed from the MVR and the characteristic dimensions of the nozzle.

Taking an MVR of PP as 13 cm³/10 min and the diameter of the MFI nozzle as 2.095 mm (r = 1.0475 mm), we obtain a shear rate of 23.5 s-1. Assuming a typical range of MVR from 5 to 25, the shear rate ranges also from 7 to 36 s-1 − all of which are far below what is encountered in industrial processes such as injection molding, extrusion, and coating, where shear rates can exceed 1000 s-1. As a result, MFI provides a limited, single-point view of how the material behaves under these more demanding conditions.
The limitations of MFI are particularly evident when it is used to compare recyclates. Recycled polymers often have varying molecular weights, levels of contamination, and degrees of degradation, all of which affect their flow behavior. Because MFI only captures flow behavior at a single, low shear rate, it may not accurately reflect how these materials will perform during processing. For example, two recyclates with similar MFI values could exhibit very different Shear ThinningThe most common type of non-Newtonian behavior is shear thinning or pseudoplastic flow, where the fluid viscosity decreases with increasing shear.shear thinning behavior, leading to processing challenges such as incomplete filling, surface defects, or material degradation.
Capillary Rheometry: A Superior Approach
To overcome the limitations of MFI, capillary rheometry serves as a more advanced and comprehensive method for assessing polymer flow behavior. A Rosand capillary rheometer, for example, allows for measurement of the shear viscosity over a broad range of shear rates and temperatures, offering a detailed picture of how the material behaves under conditions that closely replicate industrial processing environments.
Advantages of Capillary Rheometry
- Comprehensive Shear Rate Analysis: Unlike MFI, which is limited to a low shear rate, capillary rheometry measures viscosity across a wide range of shear rates, from low to very high. This range is essential for understanding how a polymer will perform under different processing conditions, such as during the rapid flow through injection molding gates or the steady flow in an extrusion process. Many times, a material with the same MFI (virgin vs. recyclate, filled vs. unfilled, current material vs. cheaper substitute) exhibits very different mold-filling behavior due to the differences in Shear ThinningThe most common type of non-Newtonian behavior is shear thinning or pseudoplastic flow, where the fluid viscosity decreases with increasing shear.shear thinning.
- Realistic Replication of Industrial Conditions: Capillary rheometry can simulate the high shear rates and StressStress is defined as a level of force applied on a sample with a well-defined cross section. (Stress = force/area). Samples having a circular or rectangular cross section can be compressed or stretched. Elastic materials like rubber can be stretched up to 5 to 10 times their original length.stress conditions as well as temperature changes encountered in actual manufacturing processes, offering a more accurate prediction of how the material will behave during processing. This is why these measurements are a requirement for mold-filling simulations.
- Detailed Shear and Elongational Characterization: Capillary rheometry can also provide insights into the elongational properties of polymers, which are relevant for processes such as extrusion and spinning. These details are crucial for optimizing processing conditions and ensuring consistent product quality.
Case Study: Polypropylene at Varying Temperatures
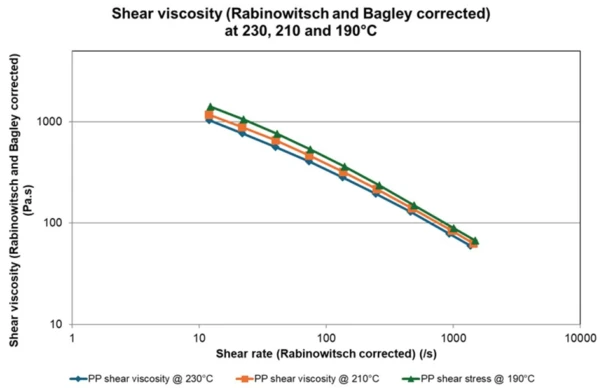
In our study, we analyzed the shear viscosity of a polypropylene (PP) material with an MFI of 8 g/10 min using a Rosand RH2000 Capillary Rheometer at three different melt temperatures, 190°C, 210°C, and 230°C. The results were then compared with computed shear viscosity values from MFI data measured at 230°C under a load of 2.16 kg.
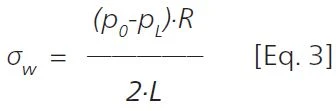
Let’s first calculate the viscosity value from the MFI test. Using Eq. 1 and 2, the true shear rate during the MFI test was calculated to be 23.5 s-1. The pressurepL can be calculated from the gravitational acceleration (g = 9.81 m/s²) and the weight of 2.16 kg used during the MFI test on PP to be 0.3 MPa. The shear StressStress is defined as a level of force applied on a sample with a well-defined cross section. (Stress = force/area). Samples having a circular or rectangular cross section can be compressed or stretched. Elastic materials like rubber can be stretched up to 5 to 10 times their original length.stress in the nozzle can be computed as:
with
pL is the pressure in the nozzle,
p0 is the atmospheric pressure,
R is the radius of the nozzle (1.0475 mm),
L is the nozzle length (8 mm).
The apparent shear viscosity is given as:

Using the true shear rate of 23.5 s-1 and the shear StressStress is defined as a level of force applied on a sample with a well-defined cross section. (Stress = force/area). Samples having a circular or rectangular cross section can be compressed or stretched. Elastic materials like rubber can be stretched up to 5 to 10 times their original length.stress calculated with Eq. 3, the computed viscosity from the MFI test is:
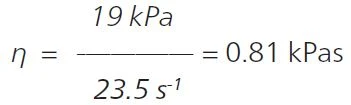
This viscosity value can now be compared to the viscosity value at the same shear rate and shear StressStress is defined as a level of force applied on a sample with a well-defined cross section. (Stress = force/area). Samples having a circular or rectangular cross section can be compressed or stretched. Elastic materials like rubber can be stretched up to 5 to 10 times their original length.stress in the capillary measurements; this is 0.76 kPas, which is a relatively close match.
The capillary measurements were performed on a Rosand RH2000. The measurement conditions are summarized in table 1.
Table 1: Measurement conditions for the Rosand RH2000 capilary rheometer
| System | RH 2000 (Double Bore System) |
|---|---|
| Shear rate | 10 s-1 up to 1000 s-1 |
| Capillary die | Ø 1.0 mm, 16 mm length, 180° entry angle |
| Orifice die | Ø 1.0 mm, 0.25 mm length, 180° entry angle |
| Pressure transducer left | 1000 Psi (6.87 MPa) |
| Pressure transducer right | 250 Psi (1.74 MPa) |
| Atmosphere | Surrounding |
| Temperature | 230°C, 210°C, 190°C |
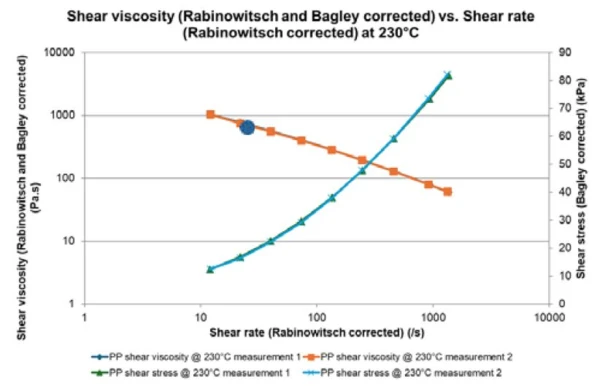
The capillary measurements revealed significant differences in the material’s behavior across the tested shear rates; see figure 1. It can be seen that in the whole shear rate range obtained, this PP shows significant Shear ThinningThe most common type of non-Newtonian behavior is shear thinning or pseudoplastic flow, where the fluid viscosity decreases with increasing shear.shear thinning behavior and the shear StressStress is defined as a level of force applied on a sample with a well-defined cross section. (Stress = force/area). Samples having a circular or rectangular cross section can be compressed or stretched. Elastic materials like rubber can be stretched up to 5 to 10 times their original length.stress increases as expected. The calculated viscosity from the MFI test is drawn as a blue dot to show the good agreement. It only represents a single point value on the graph.
In addition to the measurement over a wide shear rate range, the capillary measurements can be performed at various temperatures to understand the temperature dependence of the material. This is a necessity for using the data in processing simulations. Figure 2 shows the resulting flow curves at the three temperatures measured.
For Advanced Readers
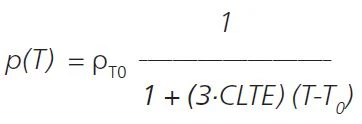
In the calculation of the single-point viscosity value from MFI measurements, numerous simplifications were made. For example, the temperature dependence of the DensityThe mass density is defined as the ratio between mass and volume. density wasn’t used to adjust the calculation of the volume flow rate for 230°C from MFI measurements using Eq. 1. More accurate would be the following:
where
with
ρT0 is the DensityThe mass density is defined as the ratio between mass and volume. density at room temperature (0.9 g/cm³ for PP)
Coefficient of Linear Thermal Expansion (CLTE/CTE)The coefficient of linear thermal expansion (CLTE) describes the length change of a material as a function of the temperature.CLTE is the Coefficient of Linear Thermal Expansion (CLTE/CTE)The coefficient of linear thermal expansion (CLTE) describes the length change of a material as a function of the temperature.coefficient of linear thermal expansion (69*10-6 K-1 for PP)
T is the measurement temperature of the MFI test (here 230°C)
T0 is room temperature
Accounting for this, the true shear rate is 18.5 s-1 instead of 23.5 s-1. Given that these shear rates are already in the Shear ThinningThe most common type of non-Newtonian behavior is shear thinning or pseudoplastic flow, where the fluid viscosity decreases with increasing shear.shear thinning regime, this has an effect on the viscosity value. This and more can be studied in Osswald, Rudolph, Polymer Rheology – Fundamentals and Applications, Hanser Publishers, Munich, 2015.