Introduction
Billions of pounds of carpet are generated annually worldwide, a large percentage of which ends up in landfills, which is problematic because nylon in non-biodegradable. Limitations in landfill capacity and the environmental impact of disposing of carpet waste in this manner have made recovering nylon from carpet waste an increasingly important enterprise.
As carpet compositions vary and can contain Nylon-6 and/or Nylon-6,6 along with variety of other materials, such as other polymer fibers (e.g. PP, PE, polyester), latex adhesive, dyes, and inorganic fillers (e.g., CaCO3 and BaSO4),1 the characterization of waste carpet composition and its thermal decomposition profile is essential for the recycling process. Thermogravimetric analysis (TGA) coupled with evolved gas analysis (EGA) by FT-IR, MS, or GC-MS enables the simultaneous analysis of a material’s thermal mass loss profile and identification of the gaseous species evolved during the decomposition.
In this study, material recovered from carpet waste was analyzed by TGA-FT-IR, TGA-MS, and TGA-GC-MS in order to compare the capabilities of the three combined thermal analysis/evolved gas analysis methods for identifying the composition of the recycled carpet.
1C. Mihut, D. K. Captain, F. Gadala-Maria, and M.D. Amiridis. “Review: Recycling of Nylon from Carpet Waste”, Polymer Eng. Sci., Vol. 41(9), pp. 1457-1470, 2001
Experimental
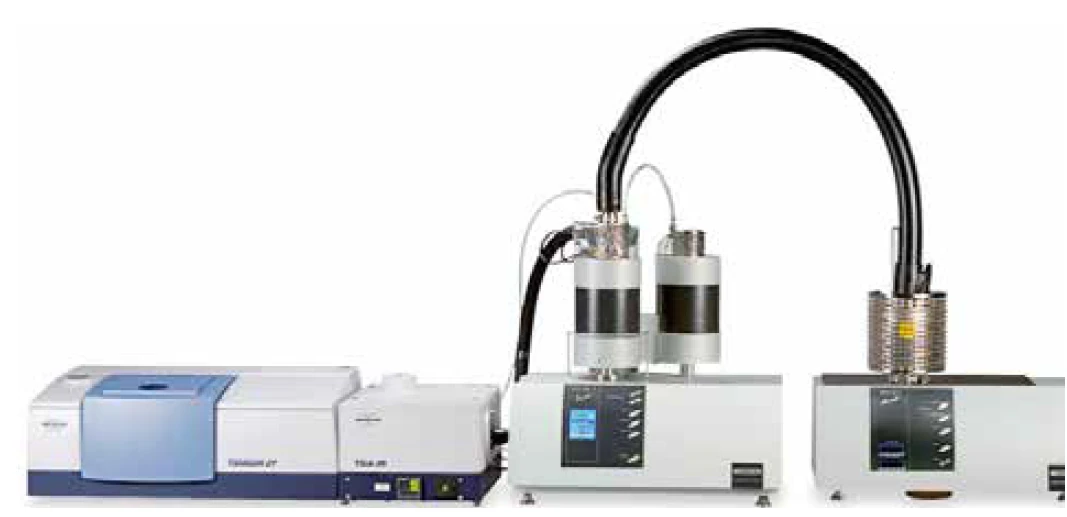
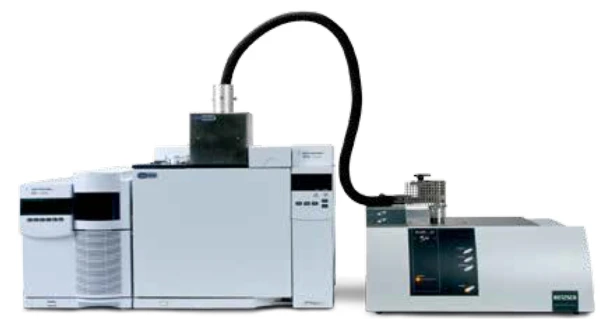
TGA-FT-IR and TGA-MS were performed using a NETZSCH TG 209 F1 Libra® thermogravimetric analyzer (TGA) coupled to a BRUKER Optics TENSOR™ FT-IR spectrometer and a NETZSCH QMS 403 Aëolos® quadrupole mass spectrometer (Figure 1). For TGA-GC-MS measurements, the NETZSCH TG 209 F1 Libra® was coupled to an Agilent Technologies 7890A gas chromatograph equipped with an Agilent 5975C quadrupole mass spectrometer (QMS) (Figure 2).
The recycled carpet samples were heated in the thermobalance from 25 to 600°C at 10 K/min under either nitrogen (40 mL/min; TGA-FT-IR and TGA-MS) or helium (65 ml/min; TGA-GC-MS). Evolved gases were passed from the thermobalance to the EGA analysis instrument via a transfer line heated at 220°C for the FT-IR and MS coupling or 300°C for the GC-MS coupling. For the GC-MS analysis, the gases were sampled every four minutes and injected onto an Agilent HP-5MS column held at 150°C and eluted with a helium gas flow of 2 ml/min. For FT-IR and MS measurements the gases were introduced continuously into an IR gas cell held at 200°C or directly into the MS analyzer.
Results and Discussion
TGA-FT-IR
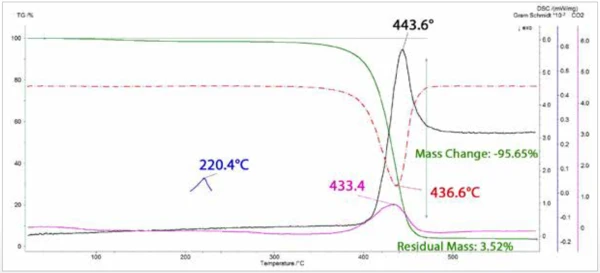
Mass loss (TGA) and mass loss rate (DTG) curves are plotted in Figure 3 along with curves for the total integrated IR absorption (Gram Schmidt) and the integrated intensity of the CO2 asymmetric stretching band. A single mass loss step was observed that peaked in rate at 436.6°C. The peaks in the DTG and CO2 curves are nearly coincident, followed closely by the peak in the Gram Schmidt curve. Also shown is a melting EndothermEin Phasenübergang oder eine Reaktion ist endotherm, wenn für die Umwandlung Wärme benötigt wird.endotherm at 220°C determined with the NETZSCH patented c-DTA® analysis.
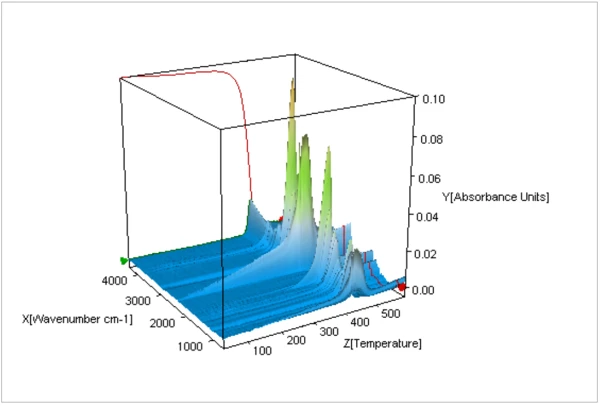
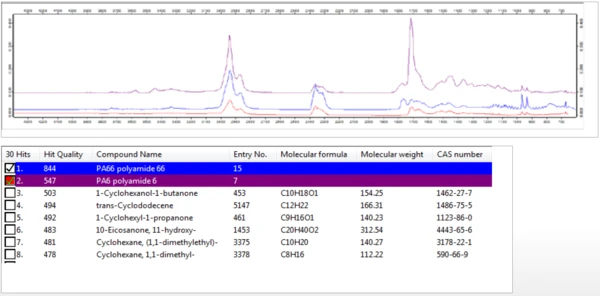
A 3-dimensional plot of the FT-IR spectra of the evolved gases over the duration of the thermal decomposition is shown in Figure 4. Individual extracted spectra were compared with a database of IR spectra in order to identify species evolved at different temperatures during the thermal decomposition. As shown in Figure 5, the FT-IR spectra of gases evolved at 460°C were consistent with that of Nylon-6,6 (PA66) and with Nylon-6 (PA6).
TGA-MS
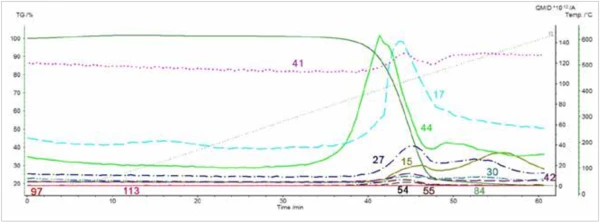
The evolution of CO2 was identified by MS analysis, but organic species were not identified with any confidence by searching extracted mass spectra from the acquisition in the NIST mass spectral library. Nevertheless, peaks in the ion currents (Figure 6) for mass numbers 15, 41, and 55, are consistent with Nylon-6, and peaks in the ion currents for mass numbers 17 and 54 are consistent with Nylon-6.6. Currents for ion masses 27, 30, and 44 are also shown. These also exhibit peaks during the decomposition, but the product ions are common to both polymers. No peaks were observed in the ion current for mass 113 (caprolactone) or 84 (cyclopentanone); however, these ions are not expected with electron impact mass spectrometric (EIMS) analysis.2
TGA-GC-MS Analysis
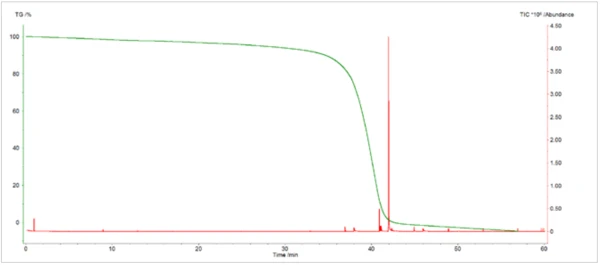
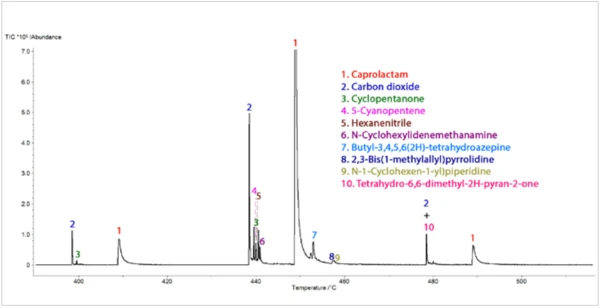
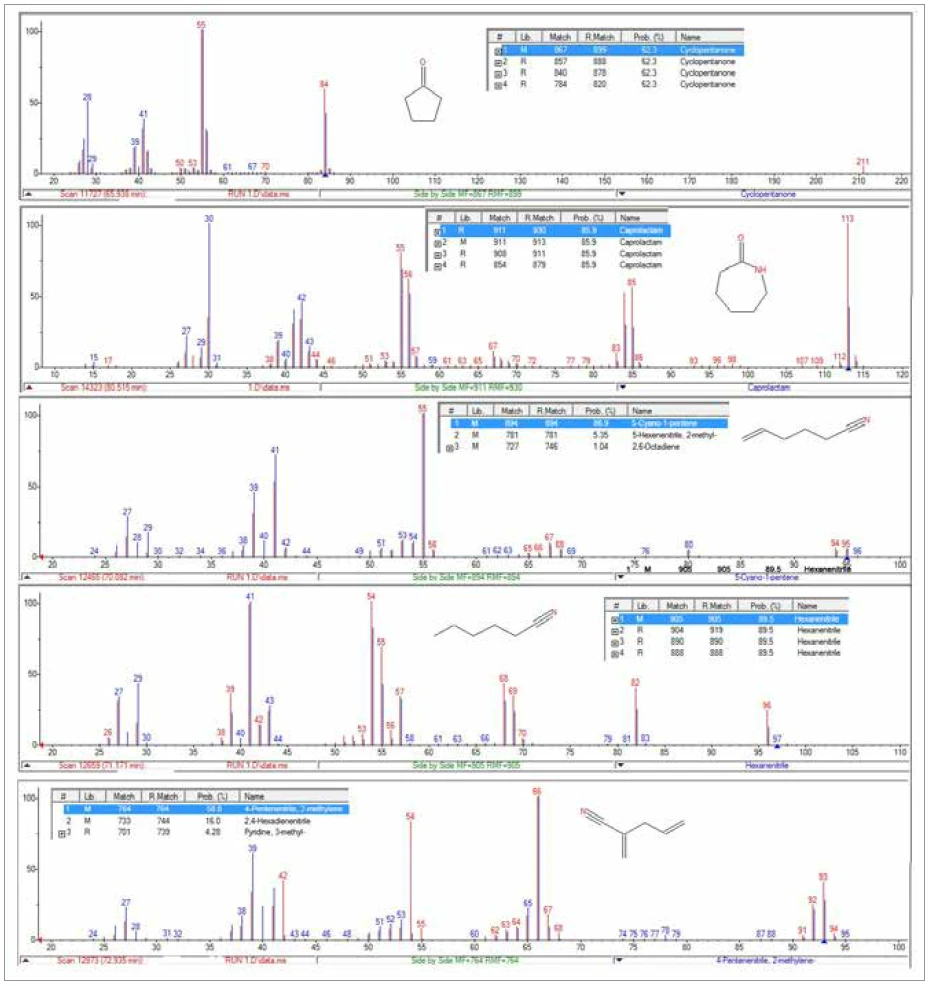
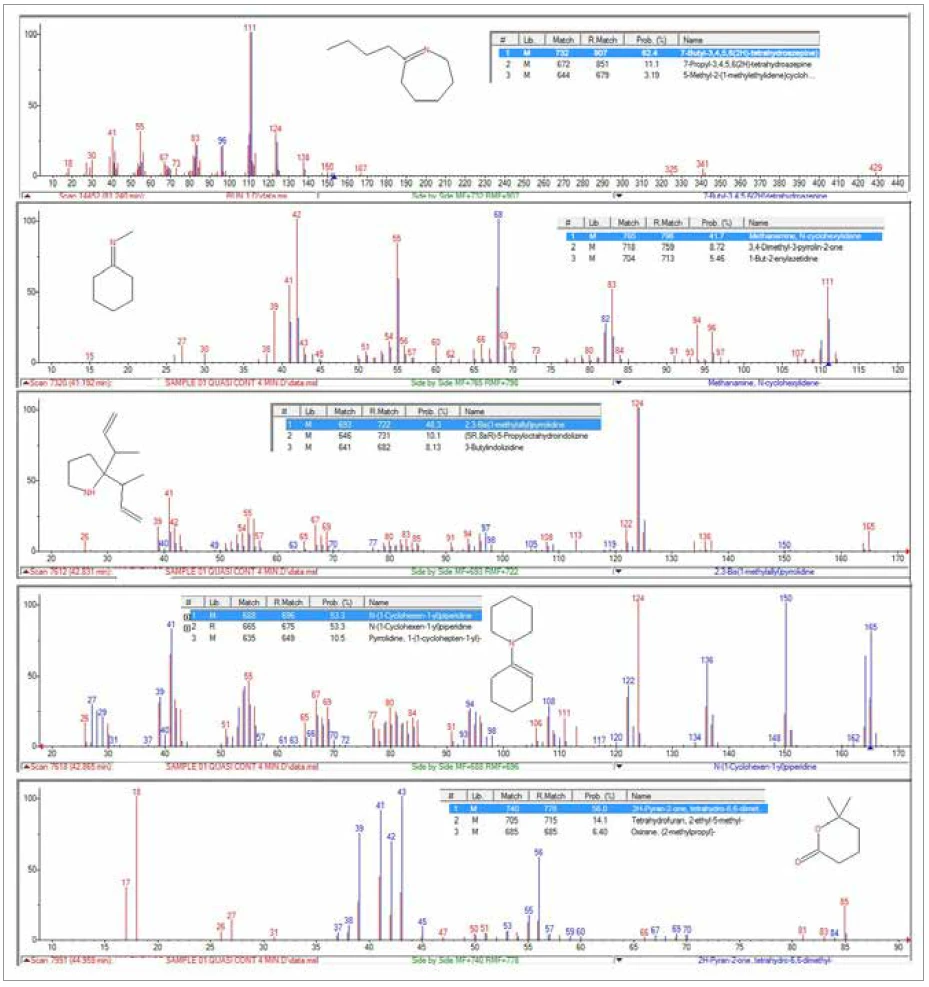
The TGA-GC-MS analysis was performed in a quasicontinuous mode by sampling the gases evolved during the pyrolysis of the sample every four minutes. Figure 7 displays an overlay of the total ion chromatogram (TIC) from the GC-MS measurement with the thermal mass loss curve. Figure 8 shows an expanded view of the TIC with peak identifications that were determined from library searches of the extracted mass spectra. Caprolactam, a primary decomposition product of Nylon-6, was the major component of the evolved gases. It started to appear in the gas sampling around 400°C and continued to appear in pulses up to around 500°C. The appearance of CO2 in the gas samplings between 400°C and 480°C was also consistent with both TGA-FT-IR and TGA-MS findings. Chromatographic separation of the gaseous components during the GC-MS analysis allowed the identification of a variety of other organic species that were not identified by either FTIR or MS analysis (Figure 9). Cyclopentanone is a thermal decomposition product most characteristic of Nylon-6,6.3
Conclusion
Each evolved gas analysis method has specific strengths and weaknesses that normally lend each one to specific applications. GC-MS is generally the most informative of the three methods due to the chromatographic separation of gaseous components, allowing their individual identification. In this study, GC-MS offered the clearest identification of caprolactam, confirming that the material consisted primarily of Nylon-6. It also identified cyclopentanone and nitrile products that are more characteristic of Nylon-6,6. A variety of other cyclic organic species, possibly products of Nylon-6,6, were identified for the first time in this study. EIMS (electron impact mass spectrometry) and FT-IR results confirmed the presence of both nylon polymers in the recycled carpet material. Molecular ion masses characteristic of both Nylon-6 and Nylon-6,6 were identified by EIMS. Although FT-IR identified both polymers as potential components of the material, due to the similarities between the spectra, this evolved gas analysis method was the least definitive with respect to which specific nylon polymer(s) were actually present.
As demonstrated in this study, thermogravimetric analysis coupled with evolved gas analysis (TGA-EGA) methods is an informative and time-saving analytical tool that is useful not only for simultaneously determining the thermal decomposition profile and chemical composition of materials, but also for elucidating the chemical processes responsible for thermal mass loss by identifying the corresponding evolved gas species.