Introduction
Formulating products to have both the correct functional and sensory attributes can be a difficult task. The latter in particular relies heavily on user feedback, which can take considerable time and effort to attain. In addition, it is not always easy to interpret such feedback in the context of material properties and hence rheological data.
To use rheology as a tool for evaluating product texture, it is important to understand which rheological test mode best mimics the particular application and also the most appropriate parameters to use in that test. For instance, skin cream application and rubbing is a high shear rate process which is best evaluated using steady shear testing at the appropriate shear rate. Conversely to the texture in the pot, the texture is related to the underlying microstructure which is best evaluated by means of oscillatory testing or creep testing.
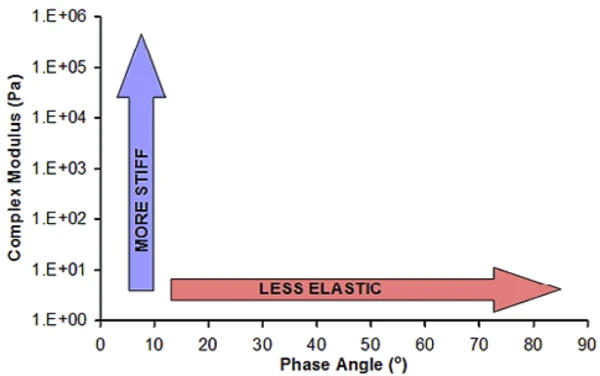
A simple test to evaluate material texture under small deformations is an oscillation amplitude sweep. This can provide important information relating to sample stiffness, springiness, structural strength and deformation. Stiffness is reflected in the complex modulus G* with higher values indicating a stiffer structure, while the phase angle δ indicates the degree of elasticity and hence springiness of the structure. This information can be presented using a simple plot of G* vs. δ as shown in Figure 1.
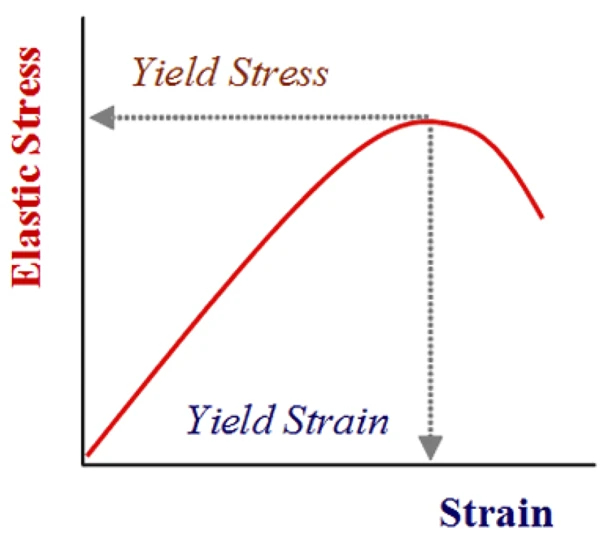
Other information which can be extracted from such a test is the Yield StressYield stress is defined as the stress below which no flow occurs; literally behaves like a weak solid at rest and a liquid when yielded.yield stress and the yield strain which relate to the structural strength and the extent of structural deformation, respectively. This information can be attained from a plot of elastic stress σ’ (stress associated with the Elastic (or Storage) Modulus G’) versus strain. A peak in the elastic stress indicates the yield point and the values of stress and strain measured at this point the Yield StressYield stress is defined as the stress below which no flow occurs; literally behaves like a weak solid at rest and a liquid when yielded.yield stress and yield strain, respectively, as shown in Figure 2.
By combining all of this information, it is possible to get an indication of how a material will respond to small shear deformations before the onset of macroscopic flow.
This can be useful for benchmarking products or to help engineer specific sensory properties or functional benefits into a product.
Experimental
- A number of different products have been evaluated to show differences between them in terms of their textural characteristics.
- Rotational rheometer measurements were made using a Kinexus rheometer with a Peltier plate cartridge and 40 mm roughened parallel plates measuring system (to avoid sample slip at the geometry surfaces)2, and utilizing standard pre-configured sequences in rSpace software.
- A standard loading sequence was used to ensure that the sample was subject to a consistent and controllablee loading protocol.
- All rheology measurements were performed at 25°C unless stated.
- The measurement involved performing a strain controlled amplitude sweep beyond the yield strain of the material and automatically analyzing the data to give a value of G* and δ within the linear region and a value for the Yield StressYield stress is defined as the stress below which no flow occurs; literally behaves like a weak solid at rest and a liquid when yielded.yield stress and yield strain based on the peak in the elastic stress (σ’).
Results and Discussion
Figure 3 compares a range of different products in terms of their relative stiffness and elasticity at a frequency of 1 Hz. From this chart, it can be seen that most samples are predominantly elastic with phase angles lower than 45º. However, these samples show varying degrees of stiffness with the body butter for example being 25 times stiffer (higher modulus) than the body lotion, and the hair gum being almost 100 times stiffer. Conversely, the shower cream is predominantly fluid-like with a phase angle close to 90º and a relatively low stiffness, with a G* value of just 23 Pa compared with approx. 8000 Pa for the body butter.
The effect of temperature on butter texture is highly significant with fat crystallization at low temperatures (fridge) forming a stiff and highly elastic structure while at room temperature, the melting of this fat matrix results in a softer and less elastic structure, more similar in texture to the body butter product and the toothpaste.
Table 1 shows the corresponding values of Yield StressYield stress is defined as the stress below which no flow occurs; literally behaves like a weak solid at rest and a liquid when yielded.yield stress and yield strain for the range of products. Note that Yield StressYield stress is defined as the stress below which no flow occurs; literally behaves like a weak solid at rest and a liquid when yielded.yield stress essentially describes the stress required to initiate breakdown of the network structure. Since viscoelastic fluids (δ > 45º) do not possess a network structure, Yield StressYield stress is defined as the stress below which no flow occurs; literally behaves like a weak solid at rest and a liquid when yielded.yield stress in this case relates to the stress required to initiate significant flow (shear thinning).
Table 1: Results from peak analysis of stress-strain curves
| Sample | Yield StressYield stress is defined as the stress below which no flow occurs; literally behaves like a weak solid at rest and a liquid when yielded.Yield Stress (Pa) | Yield Strain (%) |
|---|---|---|
| Mayonnaise | 11.26 | 1.79 |
| Toothpaste | 1.86 | 0.057 |
| Body butter | 15.87 | 0.81 |
| Body lotion | 2.24 | 2.63 |
| Shower cream | 10.18 | 27.22 |
| Hair styling gum | 11.12 | 0.15 |
| Butter (5°C) | 34000 | 1.06 |
| Butter (25°C) | 1.12 | 0.096 |
Comparing the body butter and the body lotion, it is clear that the former requires a higher stress to break down the structure. This is evident during product use, with the body butter requiring greater force to initiate flow. The body lotion has a higher yield strain and will deform more before thinning, suggesting a more ductile/less brittle structure. The elastic dominant mayonnaise has both a high Yield StressYield stress is defined as the stress below which no flow occurs; literally behaves like a weak solid at rest and a liquid when yielded.yield stress and yield strain reflecting its observed ‘rubbery texture’ in the jar.
Although the body wash shows a high critical stress and strain, unlike the mayonnaise, it does not possess a network structure (δ > 45º). These critical values therefore relate to the stress and deformation that the material can withstand before flow is significantly enhanced. This can sometimes be related to extent of filament formation or product stringiness.
Butter at fridge temperature has a very high Yield StressYield stress is defined as the stress below which no flow occurs; literally behaves like a weak solid at rest and a liquid when yielded.yield stress which is why it can be difficult to spread; however, at 25ºC a significant drop in Yield StressYield stress is defined as the stress below which no flow occurs; literally behaves like a weak solid at rest and a liquid when yielded.yield stress can be observed due to melting of the crystalline fat matrix. Interestingly butter is more brittle at this higher temperature as indicated by the smaller yield strain.
Conclusion
An amplitude sweep test can provide important information relating to a materials textural property such as stiffness, springiness, structural strength and brittleness. By measuring the parameters associated with these properties it is possible to build a picture of how a material will look and behave under small deformations. Such a technique is useful for characterizing and comparing material proper.
Please note that testing is recommended to be undertaken with cone and plate or parallel plate geometry – with the latter being preferred for dispersions and emulsions with large particle sizes. Such material types may also require the use of serrated or roughened geometries to avoid artefacts relating to slippage at the geometry surface.